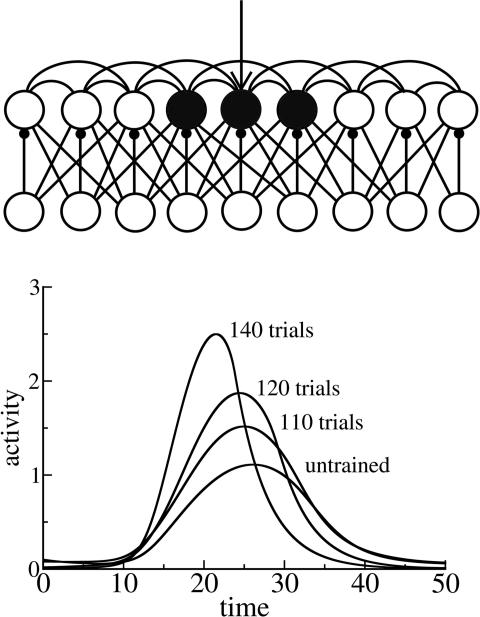
Fig. 4.
Somatosensory learning model: structure and dynamics. (Upper) Network of excitatory (upper row) and inhibitory (lower row) units used to model learning in somatosensory cortex layers 2/3. After training, several units are involved in the response to a transient stimulus applied to the trained unit, as indicated approximately by shading. (Lower) Activity levels of the trained unit as a function of time. Different curves represent activity change during training. Parameters were as follows: τe = 3; τi = 5; εe = 0.2; εi = 0.15; the = 0.1; thi = 0.2; Iexte = 5; τsyne = 300; τsyni = 150; gee = 5; gei = 3.5; gie = 1; wijie = 1. The standard deviation of the Gaussian weight function r(i, j) is 3 for both excitatory-to-excitatory and excitatory-to-inhibitory connections.

