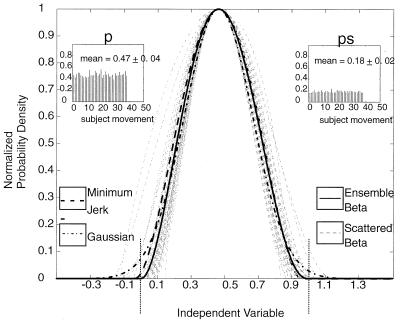
Figure 4.
Normalized β-density function parameters for the stroke patients. The Insets show the parameters (mean p and standard deviation ps) for the β-density function, which were estimated from the first two recorded movements for each point-to-point task from the stroke patients. The figure shows the ensemble best-fit β-function superimposed on each of the 38 individual β-functions, as well as a Gaussian with standard deviation equal to half the width of the ensemble β-function at 0.67 and a minimum-jerk curve with the same normalized displacement and duration. The peaks of all curves are centered at the same point.

