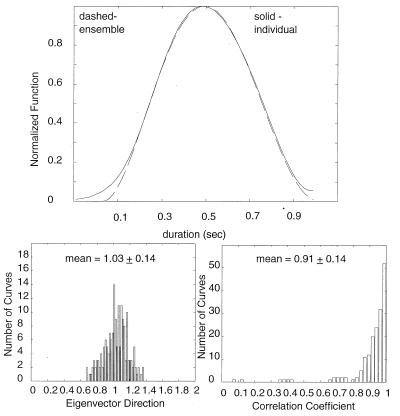
Figure 5.
Assessment of the ensemble best-fit β-function. (Upper) An example of an individual speed profile (solid line) compared with the ensemble best-fit β-function (dashed line). (Lower Left) The histogram of the slope of the principal eigenvector of the covariance matrix between the individual speed profiles and the ensemble best-fit β-function. The histogram on the Lower Right shows the correlation coefficient between the individual speed profiles and the ensemble best-fit β-function.

