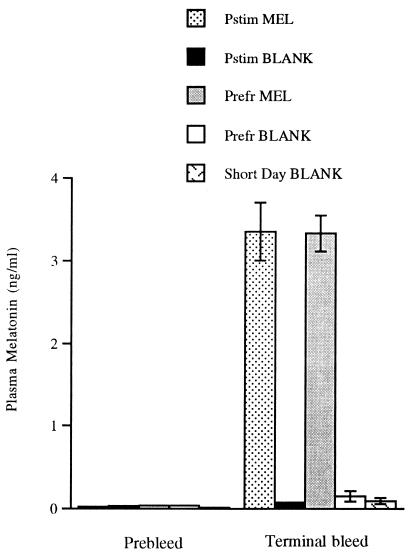
Figure 1.
Plasma melatonin before and during the experiment. Plasma melatonin concentrations in all groups of starlings were at or very close to the detection limit of the assay (0.01 ng/ml) before implantation. The graph demonstrates the rise in plasma melatonin over baseline concentrations in those groups implanted with melatonin (Pstim MEL and Prefr MEL).

