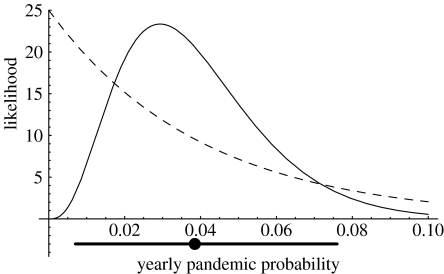
Figure 1.
Results of a Bayesian analysis for the probability of a pandemic occurring in any given year. The dashed curve indicates prior probability density of the pandemic probability based on anecdotal information. The solid curve indicates posterior probability density of the pandemic probability once data from the past century are incorporated (see electronic supplementary material). The thick bar and dot below horizontal axis are the 95% support interval and the point estimate, respectively.

