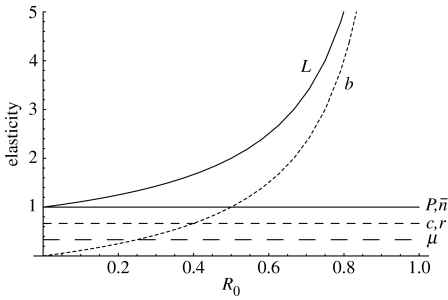
Figure 3.
Elasticity of the pandemic probability to changes in each of the model parameters (i.e. the percentage by which the pandemic probability decreases with a small percentage change in each parameter). Results are from table 1 and plotted as a function of the reproduction number of avian influenza in humans. The relative ordering of the line for μ and c,r is determined by the relative magnitude of these parameters (table 1), but both lines are always constant and less than 1.

