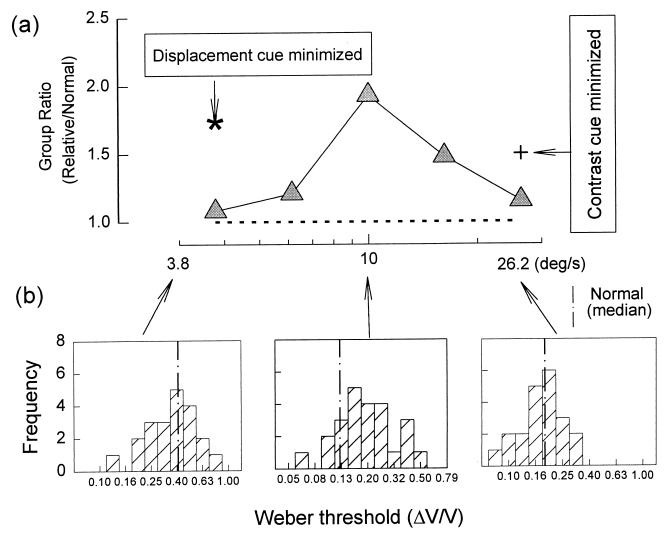
Figure 3.
Comparison of velocity discrimination between first-degree relatives of schizophrenia patients and normal controls. (a) Group ratio (as in Fig. 2, but here for relatives/normal controls) of Weber fraction thresholds plotted as a function of base velocity. The asterisk and cross sign represent group ratios after exposure time and amount of contrast of the two velocity comparison targets were randomized. (b) Histograms in the three panels represent, from left to right, the distributions of individual relatives’ thresholds at the slowest, middle, and fastest velocities. Other details are similar to those in Fig. 2.

