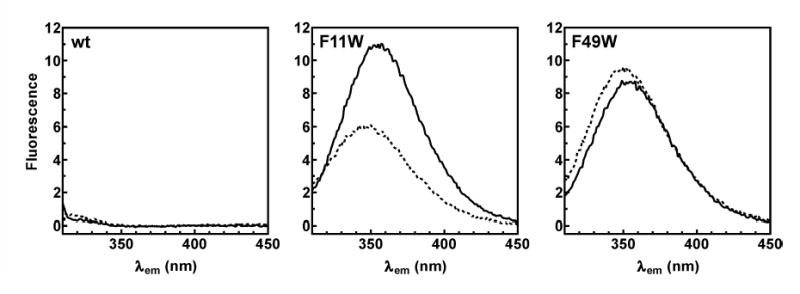
FIGURE 2.

Fluorescence emission spectra of TTP73 peptides. Blank-corrected emission spectra (λex = 295 nm) of wild type TTP73 (wt; left panel) and TTP73 mutant peptides F11W (center panel) and F49W (right panel) were measured following incubation for 20 minutes at room temperature in RNA binding buffer containing EDTA (0.5 mM; solid line) or ZnCl2 (25 μM; dotted line). Peptide concentrations were 2 μM for each sample. Spectral normalization was omitted to permit comparison of relative fluorescence quantum yields between peptides.
