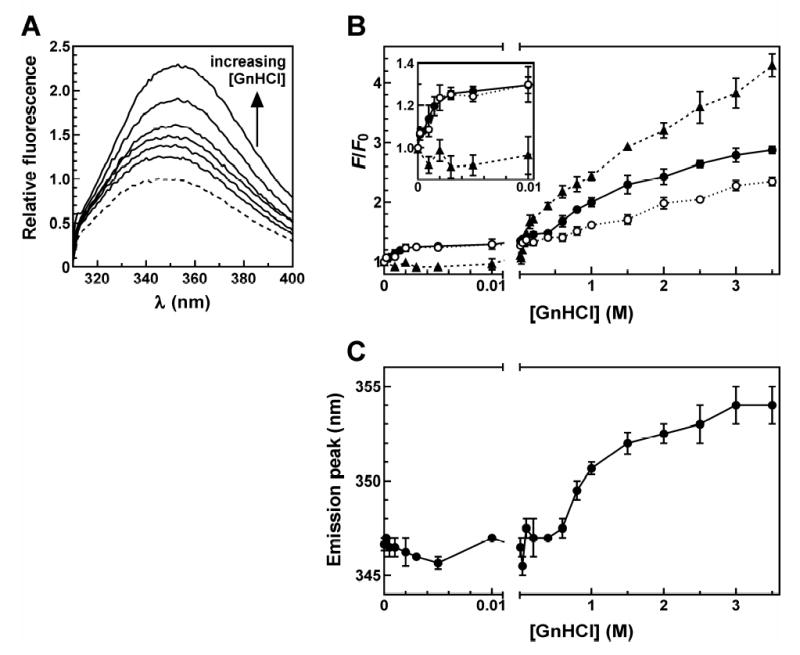
FIGURE 7.

Denaturation of TTP73 F11W by GnHCl titration. (A) TTP73 F11W (2.5 μM) samples pre-incubated with ZnCl2 (25 μM) were treated with 0.005, 0.02, 0.1, 1, 2, or 3 M GnHCl for 30 minutes at room temperature before measurement of fluorescence emission spectra (λex = 295 nm). Blank-corrected spectra are shown normalized to the sample lacking GnHCl (dashed line). (B) Fluorescence emission (λex = 295 nm; λem = 350 nm) of TTP73 F11W across a titration of GnHCl in the absence (open circles, dotted line) or presence of equimolar concentrations of RNA substrates UC13 (solid circles, solid line) or ARE13 (triangles, dashed line), normalized to emission from each F11W:RNA combination lacking GnHCl (F0). Points represent the mean ± σn−1 of triplicate independent experiments. (C) Positions of emission intensity peaks were extracted from emission spectra and plotted for TTP73 F11W samples across a titration of GnHCl in the absence of RNA. Each point represents the mean ± σn−1 of triplicate independent experiments.
