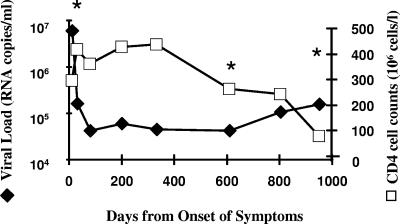
FIG. 1.
Virus load and CD4 cell counts over time. The patient's virus load (Chiron [Emeryville, Calif.] 3.0) (closed symbols) and CD4 cell numbers (open symbols) are plotted against the time in days from onset of symptoms characteristic of acute HIV infection. The time points from which HIV Envs were cloned are indicated with asterisks.

