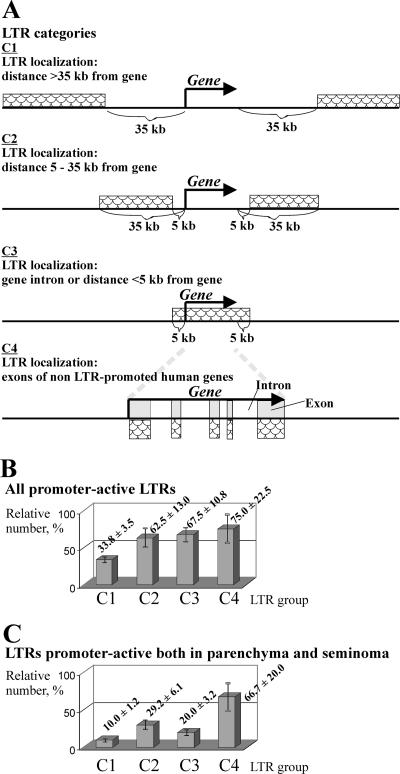
FIG. 2.
Proportions of promoter-active LTRs in four groups differing by the distance of the LTRs from known human genes or mapped cDNAs. (A) LTRs were grouped according to their distances from known human genes into four categories (C1 to C4) (see the text for details). The relative content of promoter-active LTRs in a group was calculated as the ratio of the number of LTRs in the group, for which the corresponding ELTs were obtained, to the total number of all LTRs in the group. (B) LTRs which were promoter active in at least one of the two tissues studied. (C) LTRs which were promoter active both in testicular parenchyma and in the seminoma. Averages and standard errors of the means (error bars) are presented.

