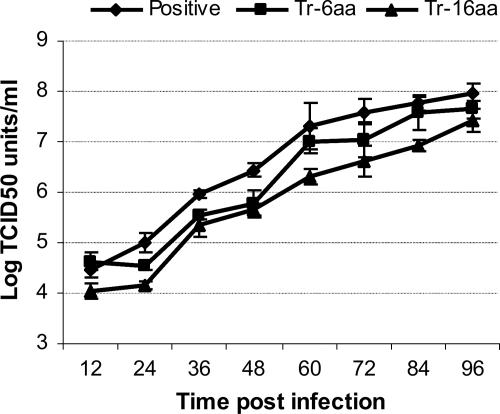
FIG. 4.
Analysis of BV production by one-step growth curve analysis. The graph shows virus growth curves for the positive control (f repair) and Tr-6aa- and Tr-16aa-repaired HearNPVs. HzAM1 cells were infected in triplicate with HearNPVs at a multiplicity of 5.0 TCID50 units per cell. Each data point represents BV production at a different time point after infection. Data points represent means for triplicate infections and titrations, and error bars represent standard deviations from the means.

