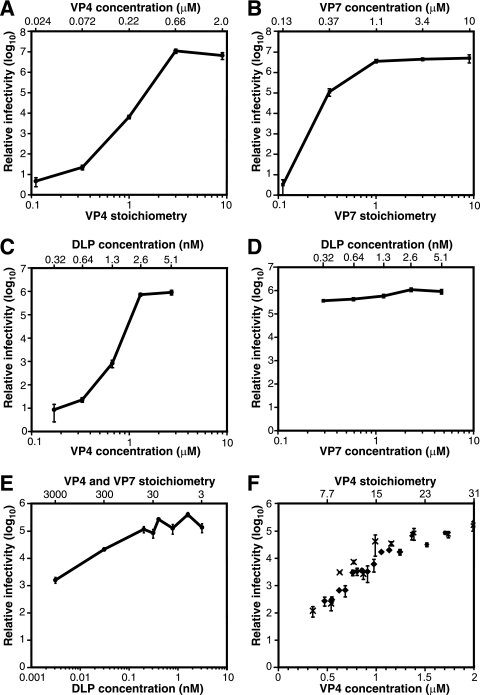
FIG. 2.
Titration of recoating reaction mixture components. Infectivity is reported relative to that of DLPs alone. In panels A to D, 3 × 10¹⁰ DLPs were used in each recoating. In panels C to F, saturating amounts of VP4 and VP7 were always present. Error bars indicate the standard deviations of three titrations of each sample. (A) Recoating with limiting amounts of VP4. The VP7 stoichiometry is 3. The VP7 concentration is 3.4 μM. (B) Recoating with limiting amounts of VP7. The VP4 stoichiometry is 9. The VP4 concentration is 2 μM. (C) Dependence of recoating on the concentration of VP4 and DLPs. The VP4 and DLP concentrations were varied in parallel by dilution with VP7 in TNC. The VP7 concentration is 4.7 μM; the VP7 stoichiometry varies from 1 to 16; the VP4 stoichiometry is 3. (D) Dependence of recoating on the concentration of VP7 and DLPs. The VP7 and DLP concentrations were varied in parallel by dilution with VP4 in TNE. The VP4 concentration is 2.8 μM; the VP4 stoichiometry varies from 3 to 48; the VP7 stoichiometry is 1. (E) Titration of DLPs. The VP4 concentration is 1.7 μM, and the VP7 concentration is 8.7 μM. The stoichiometries of VP4 and VP7 vary inversely with the amount of DLPs. VP4 and VP7 are present in the same stoichiometry. (F) Titration of VP4. The VP7 concentration is 0.9 μM; the VP7 stoichiometry is 3.6. The DLP concentration is 0.32 nM; the DLP quantity is 9.4 × 10⁹ particles. The data points marked by diamonds and crosses are taken from separate experiments. Note that the abscissa of this panel is on a linear scale.

