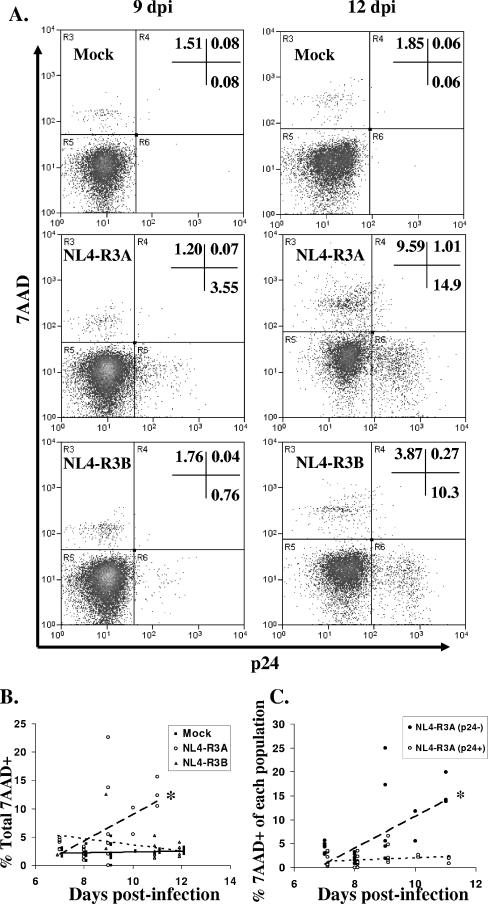
FIG. 2.
Increase in 7AAD+ thymocytes in NL4-R3A-infected HF-TOC is predominantly in the p24− population. (A) Cells in the scatter-defined live cell gate were stained for 7AAD to measure dead cells and p24 to measure productively infected cells. Shown are representative plots for mock-, NL4-R3A-, and NL4-R3B-infected thymus at 9 and 12 dpi. (B) The percentage of 7AAD+ thymocytes in the live gate for mock-, NL4-R3A-, and NL4-R3B-infected thymus over time. (*, P < 0.05 for NL4-R3A trend line relative to mock and NL4-R3B.) (C) The increase in 7AAD+ cells occurs predominantly in the uninfected (p24−) population of the NL4-R3A-infected thymus. The proportion of uninfected thymocytes (p24− thymocytes) and infected thymocytes (p24+ thymocytes) which are 7AAD+ is shown. (B and C) Data are from seven independent experiments. (*, P < 0.05 for p24− trend line relative to p24+.)

