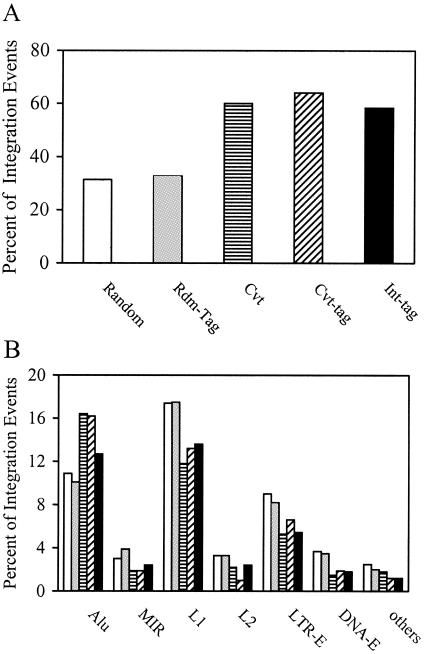
FIG. 6.
Analysis of chromosomal features associated with integration events by use of the high-throughput Int-tag assay and the conventional assay. Integration site sequences were determined using the conventional assay (striped bars) or the Int-tag assay (black bars) or generated in silico (open bars). Rdm-tag (gray bars) and Cvt-tag (hatched bars) sequences were derived from integration site sequences generated in silico and by the conventional assay, respectively, as described above. The locations of the integration sites were mapped, and chromosomal features in the vicinity of the integration sites were identified. (A) Transcription units. Integration site sequences that mapped to a unique chromosomal location were analyzed and scored as a part of a transcription unit only if the transcription unit was a member of the RefSeq genes. (B) Identifiable repeat sequences. Integration site sequences that mapped to multiple locations were analyzed for identifiable repeat elements, including Alu and mammalian interspersed repeat (MIR) of the SINE, L1 and L2 of the LINE, LTR-E, and DNA-E.

