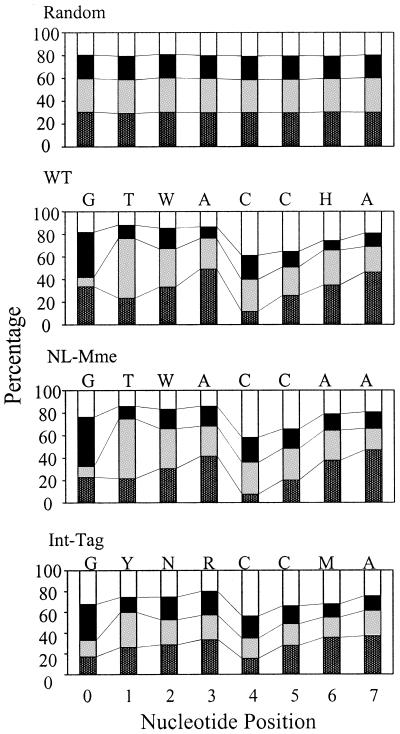
FIG. 7.
Base preference in genomic sequence immediately adjacent to integration sites. The numbers on the x axis represent nucleotide positions of human DNA adjacent to the proviral DNA, where the point of joining between the HIV and human DNA lies to the left of position 0. The height of the bar represents the percent frequency of each base. A, T, G, and C are denoted by dark gray, light gray, black, and open bars, respectively. The preferred sequence is listed on the top of each panel. H denotes A, C, or T but not G; M denotes A or C; N denotes A, C, G, or T; R denotes A or G; W denotes A or T; and Y denotes C or T.

