FIG. 2.
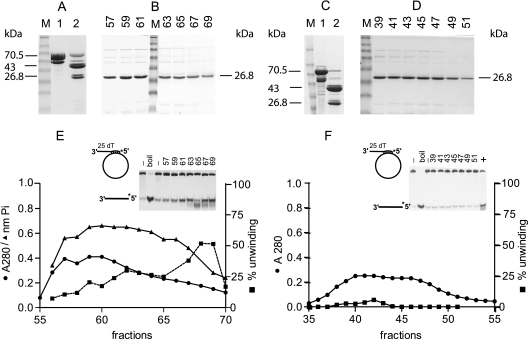
Purification of Rep122-359 and Rep122-359K227A. Panels A, B, and E display the purification steps for Rep122-359, and panels C, D, and F correspond to Rep122-359K227A purification. In panels A and C, lanes 1 are MBP-Rep120-359 and MBP-Rep120-359K227A, respectively; in lanes 2 are factor Xa digestion products of the corresponding proteins. The molecular masses of the different purified proteins are indicated. Panel B shows SDS-PAGE of DEAE fractions 57 to 69 of Rep122-359, and panel F shows the corresponding fractions 39 to 51 of Rep122-359K227A. Lanes M, molecular mass markers in kDa (175, 83, 62, 47.5, 32.5, 25, 16.5, and 6.5). Panel E shows the absorbance profile at 280 nm (•), the ATPase activity (nanomoles of Pi released) determined with 1 μl of the fraction for a 50-μl reaction mixture (▴), and the percentage unwinding with 0.5 μl of the fractions per 10 μl of assay mixture (▪). The M13-derived substrate used is shown, and the inset shows the gel used to quantify helicase activity; the two first lanes correspond to the substrate alone, with and without boiling, and numbers on top of the gel correspond to fraction numbers. Panel F shows Rep122-359K227A absorbance and activity profiles; details are as for panel E. Lane + in the inset corresponds to a positive control with Rep122-359.

