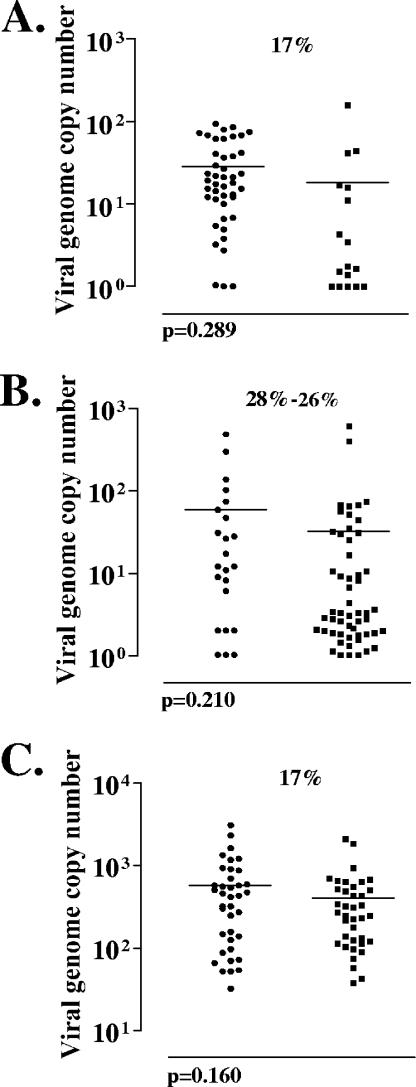
FIG. 8.
The numbers of viral genome copies present in individual latently infected neurons. The numbers of copies of the viral genome present in each of the positive neurons from Fig. 6 are shown. Each point represents a single neuron. Shown are viral genome copies in neurons from ganglia latently infected with ΔTfi and ΔTfiR when 17% of neurons were latently infected (A), when 28% and 26% of the neurons were latently infected (B), and when 17% of neurons were latently infected but analyzed in groups of 10 neurons instead of individually (C). In this last case, each point represents 10 neurons.

