
FIG. 5.
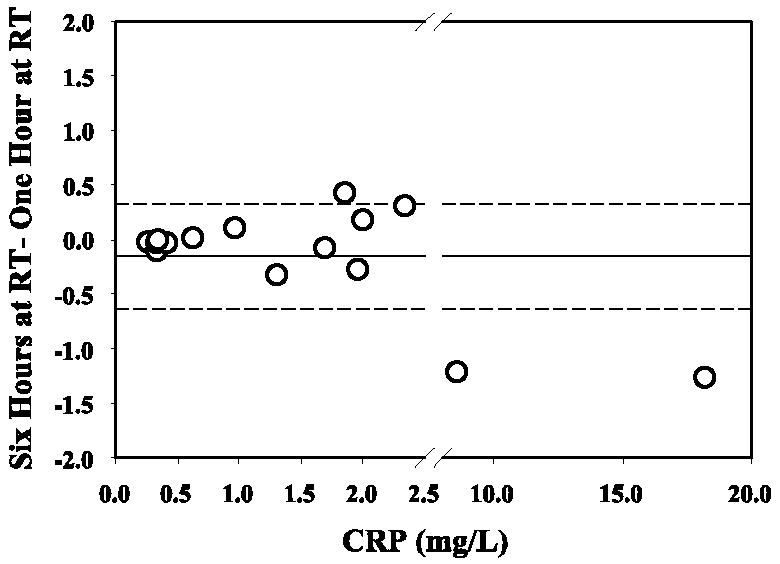
CRP concentrations are not affected by delays in specimen processing. Circles represent differences in CRP values (n = 15) for clotted blood samples that were stored at room temperature (RT) for 6 h compared to 1 h prior to centrifugation and separation of serum. The mean difference is shown as a solid line. The broken lines represent ±1 SD.