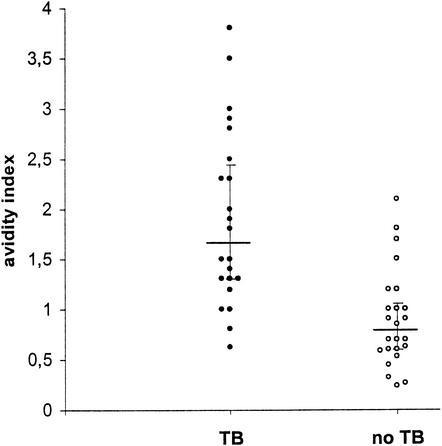
FIG. 3.
Average avidity of anti-M. tuberculosis IgG antibodies in untreated patients with pulmonary TB and patients with other pulmonary diseases. Closed circles represent individual TB patients, and open circles represent negative controls. Horizontal bars represent the median avidity indices in the groups; vertical error bars show the interquartile range. Antibody avidity indices in TB patients were significantly higher than those in patients with other pulmonary diseases (P < 0.001).

