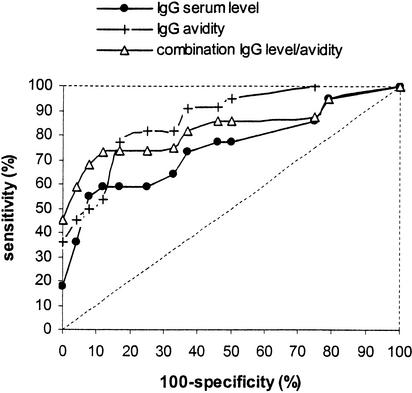
FIG. 5.
ROC curves based on serum levels of anti-M. tuberculosis IgG antibodies, IgG avidity, or a combination of both. The broken line represents the ROC curve of a hypothetical test completely lacking diagnostic value. A test based on IgG avidity or a combination of IgG levels and IgG avidity had more diagnostic value than a test based on IgG levels alone.

