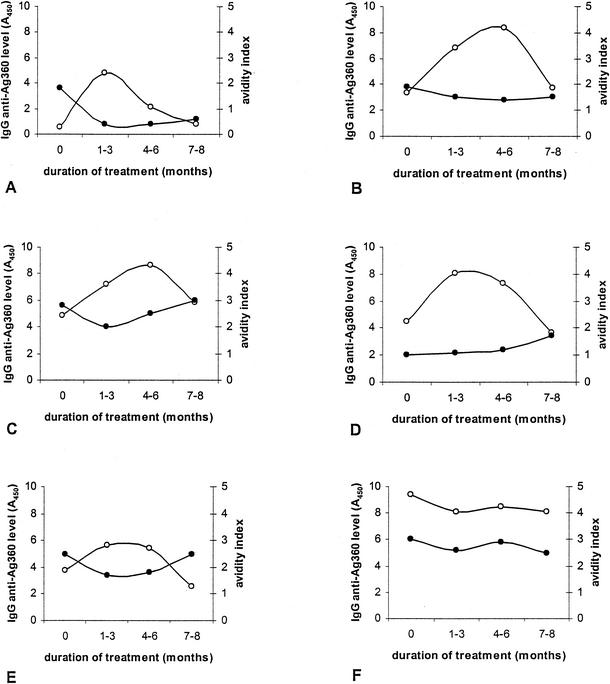
FIG. 6.
Changes in specific antibody levels and avidity during treatment of six patients (A to F) with smear-positive pulmonary TB. The x axis is divided into four time periods: the pretreatment period and three periods during anti-TB therapy. Closed circles represent antibody avidity; open circles represent antibody levels.

