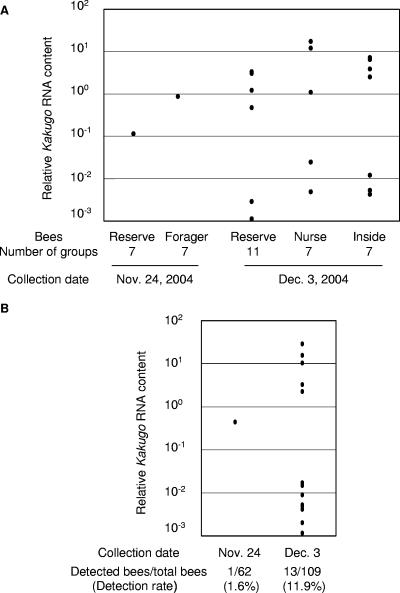
FIG. 2.
Change in KV prevalence within a colony. (A) Reserve bees or other worker populations (foragers collected on 24 November and nurse bees and inside bees collected on 3 December) were collected from colony 6. Each individual bee was homogenized separately, aliquots of the homogenates from 10 samples were mixed as a group, and the Kakugo RNA and actin mRNA of each group were quantified using quantitative RT-PCR. The relative Kakugo RNA contents normalized to that of actin mRNA are indicated by dots. The populations of bees, numbers of groups examined, and collection dates are indicated below the graph. (B) The relative Kakugo RNA contents of each individual were quantified using samples in the groups from which Kakugo RNA was detected in panel A and are indicated by dots. The numbers of collected reserve bees and Kakugo-positive reserve bees and the detection rates are indicated below.

