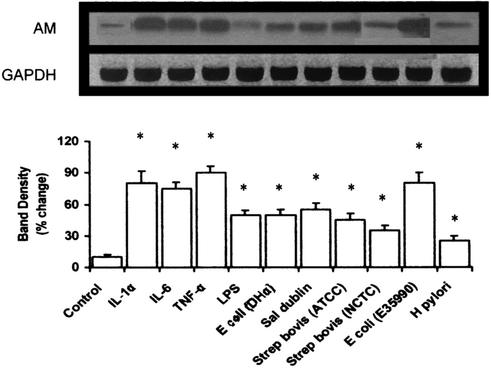
FIG. 3.
AM mRNA expression in human AGS gut epithelial cells after exposure to cytokines, LPS, or pathogens. Representative Northern blot image (upper panel) of AM mRNA levels after treatment with LPS (2 μg/ml), IL-1α (20 ng/ml), IL-6 (20 ng/ml) or TNF-α (20 ng/ml) for 4 h or a 2 × 10⁷-CFU/ml dose of E. coli E35990, E. coli DH5α, H. pylori, S. enterica serovar Dublin, S. bovis NCTC 8133, or S. bovis ATCC 9809 for 1 h. Lower panel, graph showing relative intensity of AM mRNA expression after scanning densitometry and normalization to GAPDH expression. Values are means ± standard errors of the means (n = 3). *, P < 0.05 compared to nonexposure (by analysis of variance).

