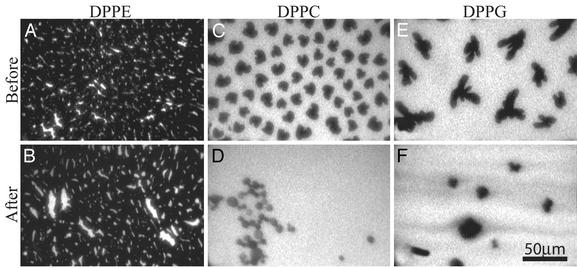
Fig. 6.
Epifluorescence micrographs showing the phospholipid films before (A, C, and E) and after (B, D, and F) injecting PG-1 at 20 mN/m. (A and B) DPPE. (C and D) DPPC. (E and F) DPPG. The relative increase in bright area from A to B, C to D, and E to F corresponds to the increase in the disordered fluid phase caused by PG-1 insertion. Images B, D, and F were taken after the maximum lipid area per molecule change was reached and no further morphological changes were observed.

