
Figure 2.
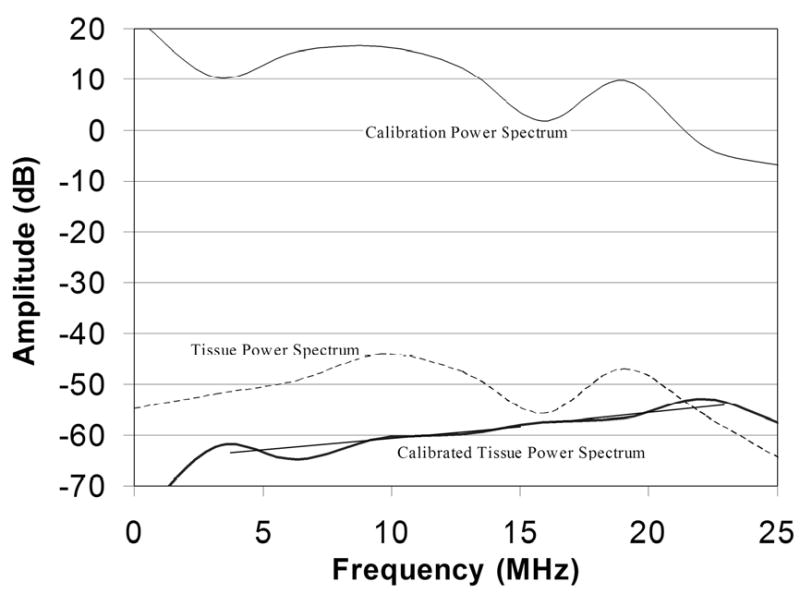
The pulse/echo calibration power spectrum of the diagnostic probe obtained under high excitation voltage with a quartz plate in the focal plane shows a harmonic of the 9-MHz fundamental at 18-MHz. The figure also shows a representative untreated tissue power spectrum, which is similar in general form to the calibration spectrum. The calibrated tissue power spectrum corrects the raw tissue spectrum against the calibration spectrum. Linear regression lines within the fundamental and harmonic bands are shown.