Figure 5.

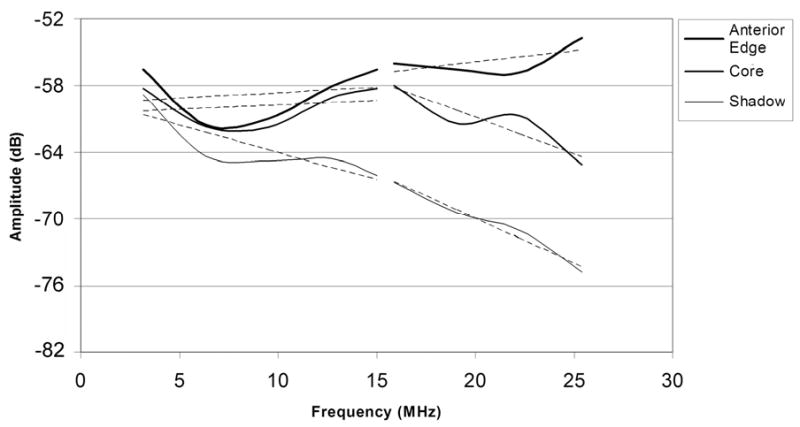
Mean calibrated power spectra obtained from the anterior edge, central core and ‘shadow’ of the lesion shown in Fig. 4, with linear best fit lines for fundamental and harmonic bands superimposed.

Mean calibrated power spectra obtained from the anterior edge, central core and ‘shadow’ of the lesion shown in Fig. 4, with linear best fit lines for fundamental and harmonic bands superimposed.