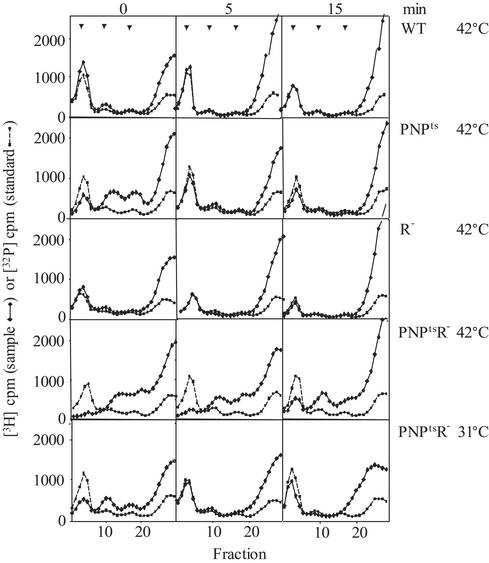
Fig. 5.
Sedimentation analysis of pulse–chased ribosomes. Cultures were grown as described in Fig. 1. Cells at 31°Corat42°C for 4 h were pulse-labeled with 5 μCi/ml [3H]uridine for 5 min and chased with 400 μg/ml rifampcin for the times indicated at the top of the figure. For size standards, wild-type cells were grown in low-phosphate YT medium with 32Pi at 37°C. 3H- and 32P-labeled S30 extracts (≈20,000 cpm) were analyzed as in Fig. 4. The temperature of the pulse–chase and the cells used are indicated on the right. Arrows indicate positions of 70S, 50S, and 30S ribosomes.

