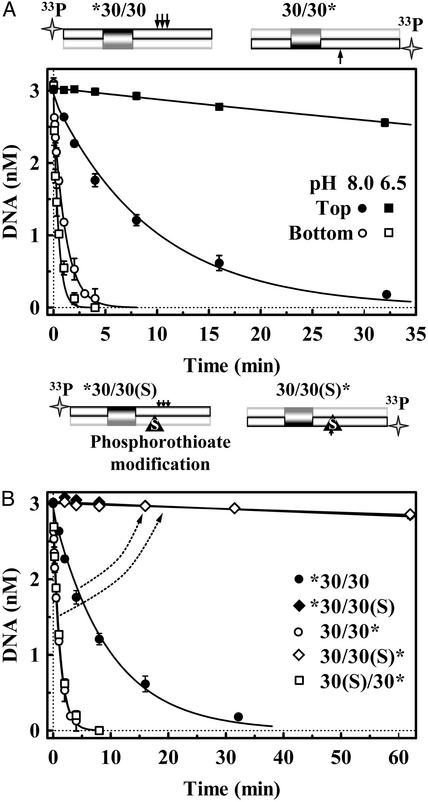
Fig. 1.
Cleavage of top and bottom strands. The cartoons above A and B illustrate the DNA substrates used: arrows mark BfiI cleavage sites. (A) The reactions at 25°C contained 3.0 nM duplex, either *30/30 or 30/30*, and 50 nM BfiI dimer, in pH 8.0 or pH 6.5 buffer. At pH 8.0: •, top-strand cleavage (from *30/30); ○, bottom-strand cleavage (from 30/30*). At pH 6.5: ▪, top-strand cleavage; □, bottom-strand cleavage. The solid lines are exponential fits to the data. (B) Reactions at pH 8.0 were as in A except that 30/30 duplex was replaced by 30/30(S) or 30(S)/30, which contain a phosphorothioate at the BfiI cleavage site of the bottom or the top strand, respectively. The 30/30(S) duplex was 5′ end labeled either in the top or the bottom strand: ♦, cleavage of top strand of 30/30(S); ⋄, cleavage of bottom strand of 30/30(S). □, cleavage of the 30(S)/30 duplex 5′ end labeled in the bottom strand. Also shown again here are the pH 8.0 reactions on top (•) and bottom (○) strands of the native substrate, 30/30. The arrows indicate changes in DNA cleavage profiles caused by the bottom-strand modification.

