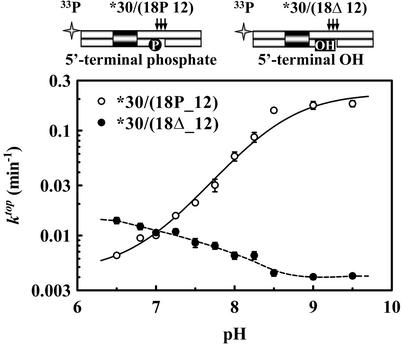
Fig. 4.
pH dependence of top-strand cleavage. The cartoons above the graph illustrate DNA substrates used: arrows indicate BfiI cleavage sites. The reactions at 25°C contained 3 nM duplex and 50 nM BfiI in reaction buffers at the indicated pH. The duplexes were: *30/(18P_12), ○ or *30/(18Δ_12), •. For each reaction, a value for ktop was determined by fitting the extent of cleavage with time to a single exponential. The optimal fit of Eq. 1 to the ktop values from *30/(18P_12), shown as a solid line, yielded the following: pKa = 8.5 ± 0.1, kESH = 0.004 ± 0.001 min–1, and kES = 0.23 ± 0.03 min–1.

