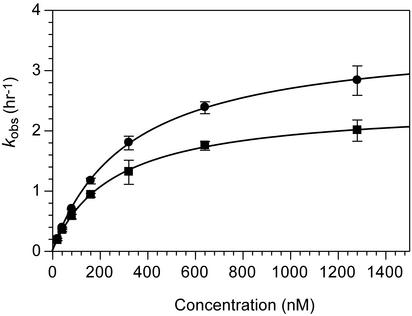
Fig. 2.
Kinetic analysis of pairs of circular and linear deoxyribozymes. • indicates reaction of LB with CA; ▪ indicates reaction of LA with CB. Initial velocities were determined by the best linear fit through three time points within the first ≈10% of the reaction. The concentrations of the circular deoxyriboxzymes (CA and CB) were 20, 40, 80, 160, 320, 640, and 1,280 nM. The concentrations of the linear deoxyribozyme catalysts (LA and LB) varied from 2 to 10 nM, but were always at least 10-fold less than that of their circular substrates. Each point represents the average of three rate measurements. Lines represent the best fit to the Michaelis–Menten equation.

