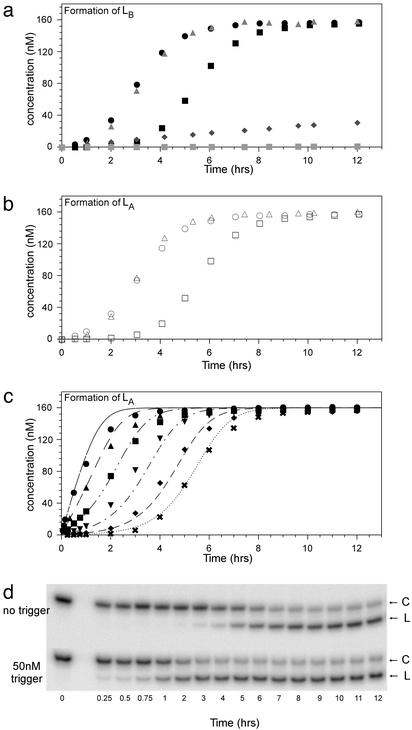
Fig. 3.
Time courses of autocatalytic cleavage. (a) Formation of LB from CB. Reactions contained 200 nM CA and 200 nM 32P-labeled CB except for  , which contained only 200 nM 32P-labeled CB. The symbols for added trigger or antisense oligonucleotides are: ▪, no added trigger; •, 5 nM LA;
 , 5 nM LB;
 , 5 nM LA; and
  , 50 nM antisense. (b) Formation of LA from CA. Reactions contained 200 nM CB and 200 nM 32P-labeled CA. The symbols for added trigger oligonucleotides are: □, no added trigger; ○, 5 nM LA; and ▵, 5 nM LB. (c) Formation of LA from CA with increasing concentrations of trigger LB. The symbols for trigger oligonucleotides are:
 , no trigger; ♦, 1 nM; ▾, 5 nM; ▪,20 nM; ▴, 50 nM; and •, 100 nM. The overlaid curves were theoretically derived based on the kinetic schema described in Materials and Methods and the rates are given in the text. (d) Denaturing (7 M urea) polyacrylamide gel analysis of an autocatalytic cleavage reaction time course. These particular data contributed to c, no trigger or 50 nM trigger. Circular (C) and linear deoxyribozymes (L) are indicated.

