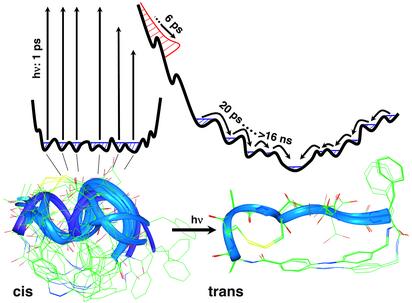
Fig. 5.
Ensemble of structures with the azobenzene unit in the cis (Lower Left) and trans conformation (Lower Right), as obtained from NMR structure analysis (25). After photoisomerizing the built-in azobenzene unit, the random distribution of cis structures is projected onto a new potential energy surface. During the driven phase (in red), the ensemble relaxes very quickly on a 6-ps time scale and entirely floods the bottom area of the potential energy surface. During the subsequent biased diffusion phase, the system equilibrates on a discrete hierarchy of time scales, extending from 20 ps to >16 ns, toward the much better defined global minimum of the trans conformation.

