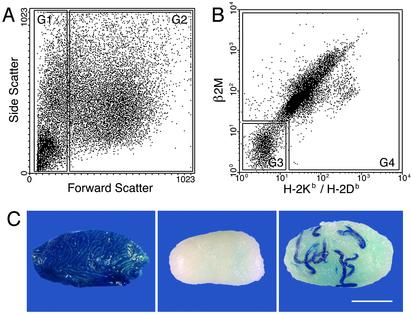
Fig. 1.
Flow cytometric analysis of cryptorchid testis cells and appearance of donor and recipient testes. (A) Gates for FACS using forward scatter. G1 is the forward-scatterlo fraction, which contains predominantly cellular debris (≈30% of objects). G2 contains the viable cells (≈70% of objects). (B) Expression pattern of MHC-I molecules in G2 of A. Cells in G3 have negative to low expression of both β2M and H-2Kb/H-2Db. G3 and G4 contain ≈14% and 86%, respectively, of cells in G2. (C) Macroscopic appearance of Rosa cryptorchid donor testis (Left), busulfan-treated testis (Center), and recipient testis (Right) transplanted with MHC-I– donor testis cells (G3) isolated by FACS. Each blue-stained stretch of cells in the recipient testis represents a colony of spermatogenesis that arises from a single stem cell (19, 20). Stain, X-Gal. (Bar = 2 mm.) The number of spermatogenic colonies generated by 105 cells transplanted to recipient testes was: G1 = 0, n = 11; G3 = 97 ± 24, n = 12; G4 = 0.4 ± 0.4, n = 12; unsorted cells = 16 ± 4.4, n = 12 (mean ± SEM).

