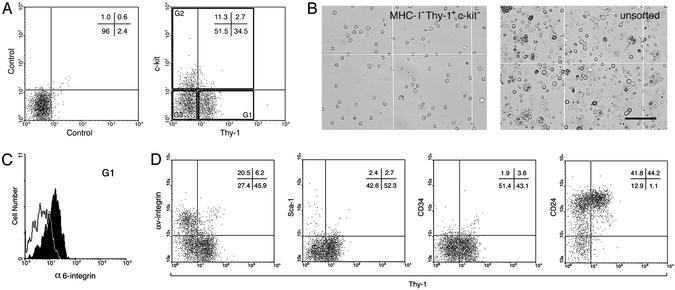
Fig. 2.
Flow cytometric analysis of the MHC-I– (β2M–) cell population of cryptorchid testis cells. (A) Unstained control (Left) and staining profile of Thy-1 vs. c-kit receptor (Right) for MHC-I– cells are shown with quadrant statistics. For transplantation assay, three populations (G1–G3) were isolated by FACS. G1–G3 represent Thy-1+c-kit–, c-kit+, and Thy-1–c-kit–, respectively. The number of spermatogenic colonies generated by 105 cells transplanted into recipient testes was: G1 = 343 ± 46, n = 17; G2 = 4.1 ± 1.7, n = 18; G3 = 2.7 ± 1.3, n = 18; unsorted cells = 14 ± 2.1, n = 18 (mean ± SEM). Because colonization efficiency is ≈5% (5, 30), ≈1 in 15 cells in G1 are SSCs [105 transplanted cells/(343 colonies/5% efficiency)]. (B) MHC-I–Thy-1+c-kit– (G1) cells sorted by FACS (Left) and unsorted cryptorchid testis cells (Right) are shown. G1 cells were relatively uniform, whereas unsorted cells were highly heterogeneous. Note characteristic pseudopods on some G1 cells. (Bar = 100 μm.) (C) α6-integrin expression was analyzed. MHC-I–Thy-1+c-kit– (G1) cells were α6-integrin+. Solid line indicates unstained cells. (D) Staining profiles of Thy-1 vs. surface molecules on MHC-I– cells are shown with quadrant statistics. MHC-I–Thy-1+ cells express CD24, but not αv-integrin, Sca-1, or CD34.

