Fig. 1.
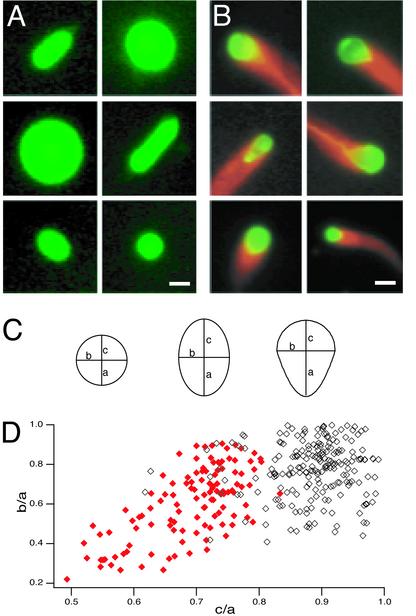
Actin-based deformation of large ActA-coated lipid vesicles in cytoplasmic extracts. (A) Shapes of control vesicles in Xenopus egg cytoplasmic extract. Pseudocolored images show typical spherical and prolate spheroid vesicle shapes. Green, fluorescein-phosphatidylethanolamine. (Bar = 3 μm.) (B) Shapes of ActA-coated vesicles with actin comet tails in Xenopus egg cytoplasmic extract. Pseudocolor images show sample frames from six time-lapse movies of vesicles associated with comet tails. Red, rhodamine-actin; green, fluorescein-phosphatidylethanolamine. The regions of overlap between red and green signals appear yellow. Vesicles associated with actin are asymmetrically deformed to a tear-drop shape. (Bar = 3 μm.) See Supporting Text for details on pharmacological manipulations of motility assays. (C) Definitions for measured parameters for circular, elliptical, and tear-drop vesicle profiles. For a perfect circle, a = b = c. For a perfect ellipse, a = c > b. For a tear-drop, a > b and a > c. (D) Scatter plot of shape distribution for ActA-coated (red, closed diamonds) and control (black, open diamonds) vesicles in Xenopus extract. The longest semiaxis is defined as a, so b/a and c/a can assume values ≤1. Control vesicles were usually nearly circular (where b/a and c/a >0.8; n = 127/241) or elliptical (where b/a <0.8 and c/a >0.8; n = 96/241). Nearly all moving ActA-coated vesicles associated with comet tails were tear-drop shaped (where c/a <0.8; n = 118/121). Both b/a and c/a were significantly smaller for the population of actin-associated vesicles than for the population of control vesicles (P < 0.0001 by Student's t test), indicating that the actin comet tails caused the vesicles to become both narrower and more asymmetrical.

