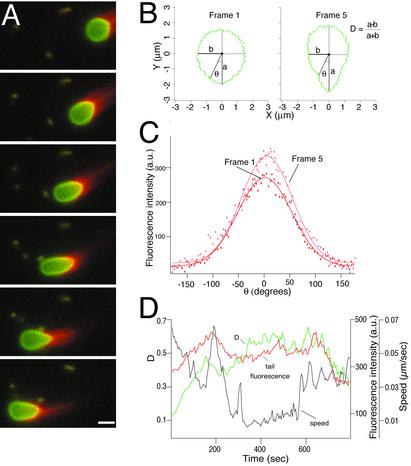
Fig. 3.
Motion analysis of ActA-coated lipid vesicles in cytoplasmic extracts. (A) Sequence of six frames from a time-lapse movie, separated by 35-s intervals, showing actin-dependent movement and deformation of an ActA-coated lipid vesicle in Xenopus egg cytoplasmic extract. Red, rhodamine-actin; green, fluorescein-phosphatidylethanolamine. The regions of overlap between red and green signals appear yellow. As the vesicle moves from right to left, it becomes increasingly elongated in frames 1–4 and then less elongated in frames 5 and 6. (Bar = 2 μm.) See Movie 1. (B) Outlines of the vesicle shown in A at frame 1 (nearly spherical) and frame 5 (elongated), reoriented so that the longest axis is vertical. The degree of deformation was measured for each frame as the dimensionless quantity D, where D = (a – b)/(a + b). D = 0 for a perfect circle, and D = 1 for a straight line. At frame 1, D = 0.11, and at frame 5, D = 0.38. (C) Angular distribution of actin filament density around the vesicle shown in A for frames 1 (red) and 5 (pink). θ = 0 at the back (pointed end) of the vesicle. Rhodamine-actin fluorescence intensity (arbitrary units) was measured for each pixel for the outlines shown in B and plotted as a function of angular position around the vesicle. Thin lines are best-fit Gaussian curves. Although the exact shape of the actin filament density distribution varies slightly from frame to frame, the peak density is always found near θ = 0 and generally falls to half-peak at about θ = ± 50°. (D) Changes over time in vesicle speed (black), deformation (green), and peak actin density (red) for the vesicle shown in A. See Supporting Text for details on quantitative image analysis.

