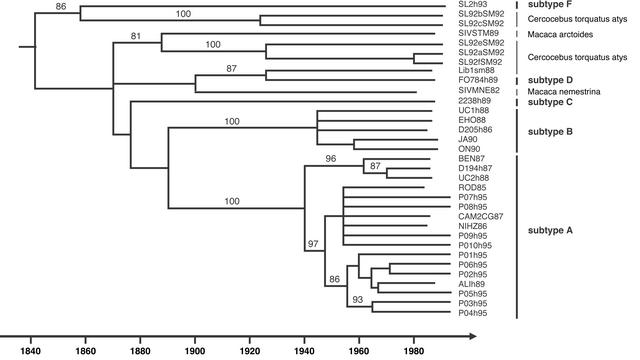
Fig. 1.
Timescale for the SIVSM/HIV-2 lineage. HIV-2 subtypes and sooty mangabey and macaque strains are indicated at the tips of the reconstructed phylogeny. Branch lengths were estimated under the SRDT model, which allowed us to impose the estimated timescale under the phylogenetic tree (19). Numbers at the nodes indicate the percentage of bootstrap samples (of 1,000) in which the right cluster is supported (only values >80% are shown).

