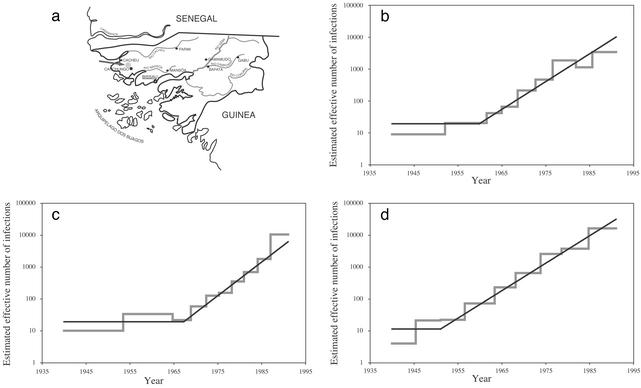
Fig. 2.
Demographic history of HIV-2 subtype A in a rural population situated near the regional center of Canchungo. (a) Map of Guinea-Bissau pinpointing the location of the study population (26, 28). (b–d) Coalescent results for the env (b), pol (c), and gag (d) genes. The skyline plots, representing nonparametric estimates, are indicated by a gray line, whereas the parametric estimates under the piecewise expansion model are indicated by a superimposed black line. Both nonparametric and parametric results show the change in the effective number of infections on a natural timescale (23).

