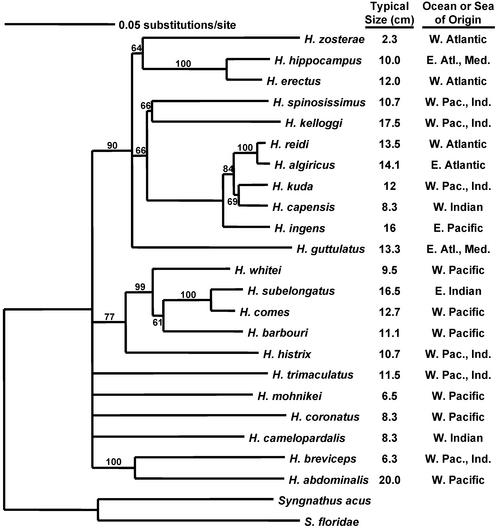
Fig. 3.
Molecular phylogeny of seahorses based on 1,141 bp of mitochondrial DNA cytochrome b sequence. The numerals near branches indicate bootstrap values. For each species we also indicate the typical adult size for each species (midpoint of adult size range) (36) and general geographic distribution (36). Although much of this phylogeny is poorly resolved, it does pinpoint at least two candidate cases of sympatric speciation in which closely related species differ dramatically in size yet overlap in geographic range (see Discussion and Fig. 4).

