Fig. 1.
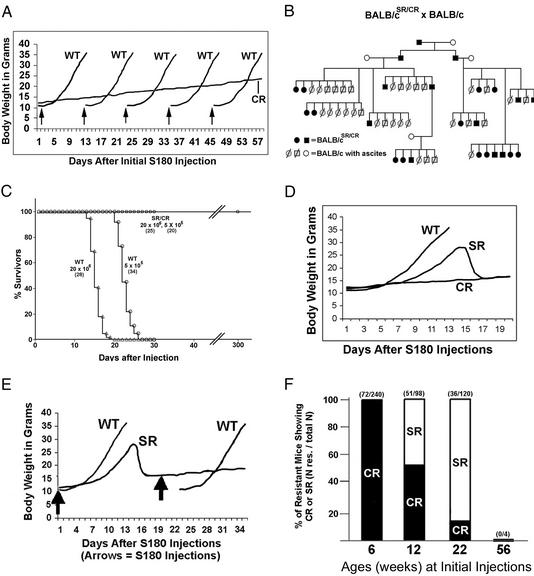
Properties of the SR/CR phenotype. (A) A representative SR/CR BALB/c mouse (CR) was weighed daily for monitoring the presence of ascites after repeated injections (arrows) of S180 cells (2 × 10e6 per injection) along with control BALB/c mice (WT) for each injection. All mice were 6 weeks old at the time of the first injection. The development of ascites in control mice was determined by a rapid increase of body weight and an enlarged abdomen. (B) Pedigree analysis was performed by crossing S180-resistant BALB/c mice with S180-sensitive normal BALB/c mice. The progeny were weaned at 3 weeks and injected with 2 × 10e6 S180 cells. Males are represented by squares and females by circles. Filled squares and circles are resistant mice. Empty circles represent control mice that are sensitive to S180 cells. Slashed squares and circles are S180-sensitive progeny. (C) Survival analysis was performed by injecting either 5 × 10e5 or 2 × 10e6 S180 cells in the progeny from the cross of a CR BALB/c and an S180-sensitive C57BL/6. Fifteen litters consisting of a total of 107 mice were divided into two dosage groups. The injections were given at 6 weeks of age. The mice that developed ascites were marked as WT and ascites-free mice were marked as SR/CR. This demonstrates the lethality of S180 cells in the sensitive mice and uniform survival of the SR/CR mice. The number of mice in each group is shown in parentheses. (D) The daily body weight graph representative of an S180-sensitive mouse (WT), a mouse with CR to ascites (CR), and a mouse that underwent SR of ascites (SR) is shown. Tumor regression in the SR phenotype occurred after day 14 and was complete at day 15. (E) SR protected mice from developing ascites again upon repeated injection (second arrow) of S180 cells. Immediately after regression, one SR mouse and one control WT mouse were injected with 2 × 10e6 S180 cells. The SR mouse failed to develop ascites again. (F) The display of either the CR or the SR phenotypes depends on the age (in weeks) when the first injection of tumor cells was given. When the first injection was given at 6 weeks, 72 of 240 progeny (cross between SR/CR BALB/c and WT C57BL/6) show the CR phenotype. When the first injection was given at 12 weeks, 51 of 98 progeny were resistant, with 26 displaying the SR phenotype and 25 displaying the CR phenotype. When the first injection was given at 22 weeks, 31 of 120 progeny showed the SR phenotype and 5 displayed the CR phenotype. Four mice that had passed the resistant trait to their offspring developed ascites and died when the first injection of S180 cells was delayed until ≈56 weeks.

