Fig. 2.
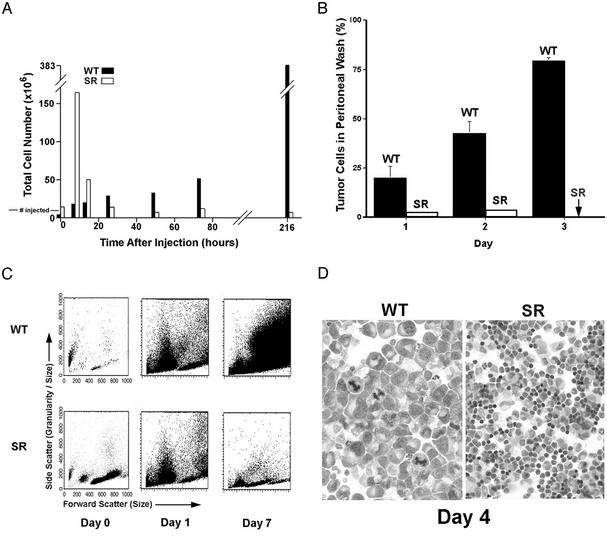
Analysis of cells derived from peritoneal washes. (A) The total number of cells of all types recovered from SR/CR or WT mice at different times after injection of S180 cells. Note the rapid influx of leukocytes at 6 h in the SR mice, followed by a rapid decline. Total cells gradually increased in the WT mice, and these were mostly cancer cells as shown (B). In the SR/CR mice, no cancer cells remained after 3 days (arrow). (C) A similar analysis using flow cytometry. By day 7, large cancer cells were dominant in the WT mice, but were absent in the SR/CR mice. (D) Cytospins of cells from the washes (shown at equal magnifications, ×100) show large cancer cells in the WT mice, but mixed leukocytes in the SR/CR mice. All data are representative of at least three analyses with similar results.

