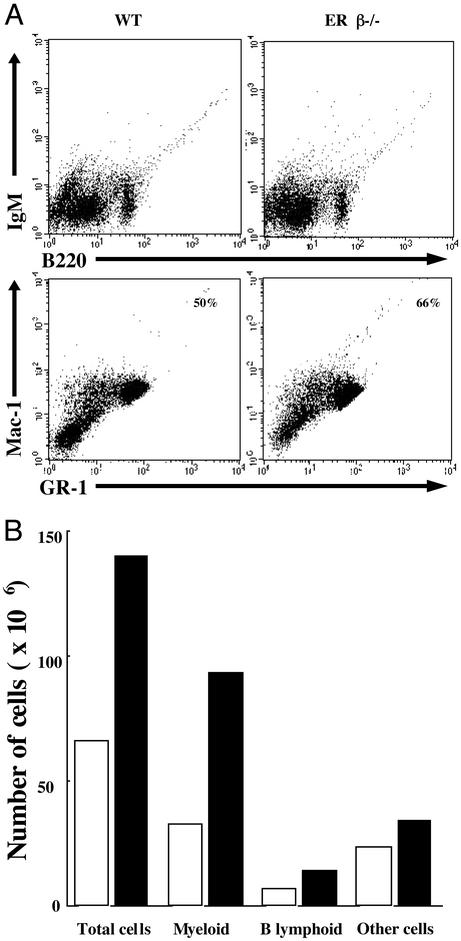
Fig. 4.
(A) Single-cell suspensions from bone marrow of ERβ–/– mice and their WT littermates were stained with indicated combinations of antibodies for flow-cytometric studies. The numbers in the boxes indicate the percentage of myeloid cells. The data show one analysis from a single mouse, which is representative of the data obtained with six pairs of mice including males and females. In mice used in this analysis, total cellularity of ERβ–/– bone marrow was increased >2-fold over control, and there was splenomegaly with granulocytosis in the blood. (B) The estimated total number of myeloid and B lymphoid cells in bone marrow of ERβ–/– (black column) and WT (white column) mice is shown. The analysis shown is one of six and is from the mice shown in A.

