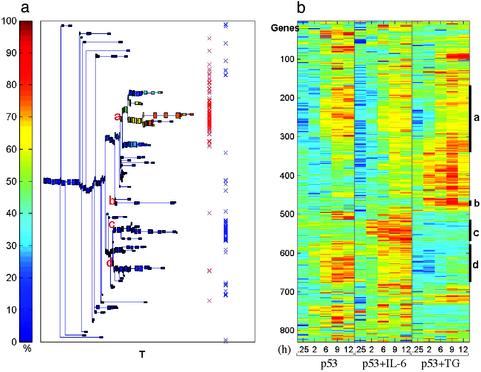
Fig. 4.
Clustering analysis of up-regulated genes by p53 in the absence or presence of IL-6 or TG. (a) Dendrogram of genes including clusters of at least five genes. Each box is colored according to the percentage of genes (of the cluster represented by the box) up-regulated by p53. Red X markings indicate genes that have a high ratio of expression in all three treatments (p53, p53+IL-6, and p53+TG), and blue X markings indicate IL-6-specific genes. (b) Expression matrix of the genes reordered according to the dendrogram. The colors represent induction (red) or repression (blue). The letters inside a and the marked bars on the right of b indicate the identified stable clusters.

