Abstract
A main oscillator in the suprachiasmatic nucleus (SCN) conveys circadian information to the peripheral clock systems for the regulation of fundamental physiological functions. Although polysynaptic autonomic neural pathways between the SCN and the liver were observed in rats, whether activation of the sympathetic nervous system entrains clock gene expression in the liver has yet to be understood. To assess sympathetic innervation from the SCN to liver tissue, we investigated whether injection of adrenaline/noradrenaline (epinephrine/norepinephrine) or sympathetic nerve stimulation could induce mPer gene expression in mouse liver. Acute administration of adrenaline or noradrenaline increased mPer1 but not mPer2 expression in the liver of mice in vivo and in hepatic slices in vitro. Electrical stimulation of the sympathetic nerves or adrenaline injection caused an elevation of bioluminescence in the liver area of transgenic mice carrying mPer1 promoter-luciferase. Under a light–dark cycle, destruction of the SCN flattened the daily rhythms of not only mPer1, mPer2, and mBmal1 genes but also noradrenaline content in the liver. Daily injection of adrenaline, administered at a fixed time for 6 days, recovered oscillations of mPer2 and mBmal1 gene expression in the liver of mice with SCN lesion on day 7. Sympathetic nerve denervation by 6-hydroxydopamine flattened the daily rhythm of mPer1 and mPer2 gene expression. Thus, on the basis of the present results, activation of the sympathetic nerves through noradrenaline and/or adrenaline release was a factor controlling the peripheral clock.
The suprachiasmatic nucleus (SCN) houses a master pacemaker that regulates behavioral and physiological circadian rhythms such as locomotor activity, body temperature, and endocrine release (1). Recently, it has been established that a number of putative clock genes such as Per1, Per2, Per3, Clock, Bmal1, Cry1, and Cry2 are expressed in the SCN, and the molecular dissection of circadian clock systems has produced a functional model of the transcription/translation feedback loops used by theses clock genes (2). This functional model can be applied to not only the SCN (3) but also the peripheral organs (4, 5) as well as rat-1 cells (6).
Destruction of the SCN abolishes not only the circadian rhythms of adrenocorticotropic hormone, glucocorticoid (7, 8), and locomotor activity (9), but also the rhythms in Per gene expression in the peripheral tissues (5, 9, 10). Thus, the SCN may communicate timing information to a variety of peripheral tissues via neural (11) and humoral (12) connections to help regulate such fundamental physiological functions such as energy metabolism, food and fluid balance, and cardiovascular, immune, and reproductive responses.
Over the past few years, use of the pseudorabies virus, a transsynaptic tract tracer, has allowed us to map neural connections between the SCN and peripheral tissues in several physiological systems (13). Communication between the SCN and peripheral tissues occurs through autonomic nervous systems involving the sympathetic and parasympathetic neurons. Sympathetic nervous system innervation of the pineal gland and sympathetic outflow from the brain to white adipose tissue demonstrated SCN–peripheral tissue connections (14, 15). Knowledge of integration of the central and peripheral clocks has led to perspective that involves a multioscillatory system in mammals (16).
Although polysynaptic autonomic neural pathways between the SCN and the liver were observed in rats (17), whether these pathways convey timing information from the SCN to the liver has yet to be established. Therefore, we examined whether adrenergic stimulation could reset the peripheral clock in mouse liver.
Materials and Methods
Animals. In all experiments except those involving transgenic mice, we used male ddY mice 4–6 weeks of age (Takasugi, Saitama, Japan). All animals were maintained under a 12 h/12 h light/dark cycle and allowed free access to food and water. Transgenic mice had a 5′ upstream region of the mPer1 gene fused to the luciferase gene, the details of which can be found in Yamaguchi et al. (18). Experimental animal care was conducted with permission from the Experimental Animal Welfare Committee in the School of Human Sciences at Waseda University (permission 00-16).
RT-PCR Method. While the animal were under ether anesthesia, ice-cold saline was perfused to remove excess blood, and a block of liver (≈500 mg) was dissected from intact and SCN-lesioned mice. Total RNA was extracted from the liver block by using Isogen Reagent (Nippon Gene, Tokyo), and then remaining DNA was removed by RNase-free DNase treatment. Total RNA (100 ng) was reverse transcribed and amplified by using Super-script One-Step RT-PCR (Invitrogen) and GeneAmp PCR System 9700 (Applied Biosystems). We used primer pairs (4, 19) that were designed on the basis of published data on mPer1, mPer2, mBmal1 (mouse brain and muscle ARNT-like 1 gene), and the β-actin gene in GenBank. PCR was executed under the following conditions: cDNA synthesis at 50°C for 30 min then 94°C for 2 min, PCR amplification for 28 cycles with denaturation at 94°C for 15 sec, annealing at 55°C for 30 sec, and extension at 68°C for 1 min. The target clock gene cDNA was co-amplified with β-actin cDNA in a single PCR tube. We used a semiquantitative RT-PCR method for measuring the expression level of mRNA. All PCR products were under the process of linear amplification from cycles 26 to 30; however, from the 32nd cycle product levels plateaued (data not shown). Therefore, PCR products in the 28th cycle were used for quantification. If necessary, 27 cycles of amplification were carried out to prevent a ceiling effect. The PCR products were electrophoresed on a 3% agarose gel, stained with ethidium bromide, and analyzed by an EDAS-290 system (Kodak). The intensity of PCR product of the target gene was normalized to the intensity of β-actin. Reproducibility of the amplitude (ratio of peak to trough) and phase as determined by this method (19) suggested that the present experimental conditions were capable of detecting a circadian change of mPer1, mPer2, and mBmal1 gene expression in the mouse liver.
SCN Lesion and Locomotor Activity. Bilateral thermal lesion of the SCN was produced as described (20). To assess the locomotor activity, mice were housed individually in transparent plastic cages (31 × 20 × 13 cm). Locomotor activity rhythms under light/dark conditions were recorded through area sensors (FA-05 F5B, Omron, Tokyo) with a thermal radiation detector system located near the food hopper to enable the detection of feeding-related movement. Data were stored on a personal computer. One month after surgery, χ2-periodogram analysis confirmed the loss of circadian activity/rest cycles in lesioned animals, and the extent of the lesion was determined by posthoc histological analysis using cresyl violet staining. In the end, 47 of total 60 SCN-lesioned animals were used for this study.
Hepatic Slice Preparation. Mouse liver slices 500 μm thick were prepared. Each slice was preincubated for 4 h in Krebs–Ringer solution and exposed to the drug for 1 h. Tissue was frozen by liquid nitrogen. mPer1 was analyzed by either a luciferase assay (for Fig. 2F) or RT-PCR (for Fig. 2).
Fig. 2.
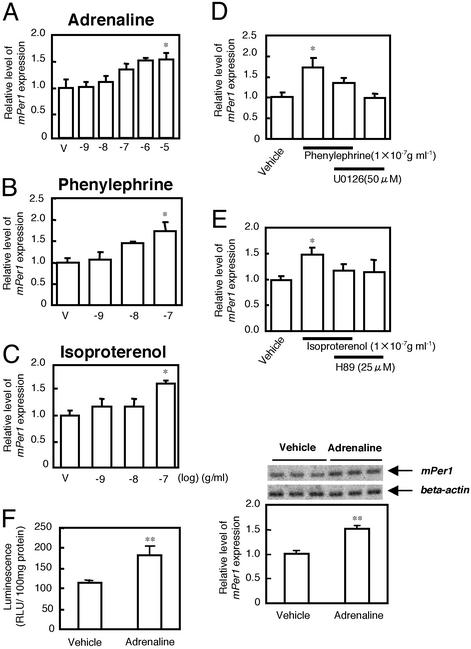
Effect of adrenaline on mPer1 gene expression in liver slices in vitro. mPer1 mRNA was expressed in a manner dependent on the concentration of adrenaline (A), phenylephrine (B), and isoproterenol (C). The vertical values reflect the relative mRNA levels of mPer1 or mPer2 as the ratio to β-actin mRNA levels. mPer1 or mPer2 levels in the vehicle (V)-treated group are set at 1.0. Each point represents three to six animals. *, P < 0.05; Dunnett's test. (D and E) Effect of mitogen-associated protein kinase (MAPK) kinase (D) and protein kinase A (PKA) (E) inhibitor on adrenaline-induced mPer1 gene expression. Each point represents three to six animals. *, P < 0.05; Student's t test. (F) In vitro study of the effect of adrenaline (0.1 μg/ml, for 60 min) on RLU and mPer1 mRNA expression in the liver of transgenic mice carrying the mPer1 promoter-luciferase. Both bioluminescence (RLU) and RT-PCR products of the intrinsic mPer1 gene transcript were measured in hepatic slices (12 slices from three animals for each point). Images of mPer1 and β-actin RT-PCR products after electrophoresis are shown above each figure. **, P < 0.01, Student's t test.
Luciferase Assay in Vitro. Transgenic mice carrying the mPer1 promoter fused to a firefly luciferase gene were killed at ZT 3 (Zeitgeber time, in hours; ZT 0 is defined as lights-on time and ZT 12 as lights-off time), 7, 15 and 20. Total protein was extracted from previously dissected liver blocks with Cell Culture Lysis Reagent (Promega). Luciferase activity was detected with Gene Light 55/GL100 (Yamato Scientific, Tokyo). Relative light units (RLU) per 100 mg of protein from the intact mouse liver without mPer1 promoter-luciferase was between 20 and 30 units/100 mg of total protein (data not shown).
Visualization of mPer1-luc Luminescence in the Liver in Vivo. On the experimental day, each mouse was anesthetized at ZT 2 with an injection of urethane (1.4 g/kg, i.p.), and supplemental doses were given hourly as needed. A polyethylene catheter (PE-10 fused with PE-50) filled with heparinized saline (50 international units/ml) was introduced into the femoral vein. Saline containing 10 mM luciferin was administered at a rate of 15 μl/h. These experimental conditions keep luciferin in the blood at a constant level (3.49 ± 0.17 μM; n = 6) for up to 360 min after injection. Bilateral pneumothorax was produced in each mouse by incisions made in the chest wall. Mechanical ventilation was provided with oxygen-enriched humidified air at a tidal volume of 8 ml/kg by using a Harvard ventilator (model 687, South Natick, MA). Normal blood gases [pH = 7.34 ± 0.01, arterial O2 pressure was 356 ± 7 torr (1 torr = 133 Pa), arterial CO2 pressure was 42.8 ± 0.4 torr] were maintained by adjusting the ventilator rate and by infusing sodium bicarbonate.
The detailed procedure for immobilization and physical operation is described in Mutoh et al. (21). The fourth cervical (C4) branch of the left splanchnic nerve hepatic branch was isolated in the neck and cut distally. The splanchnic nerve was placed on a bipolar silver hook electrode and covered with a mixture of warm petroleum jelly and mineral oil, then electrically stimulated (5 V, 5 ms, 3 Hz) for 30 min.
RLU in vivo were detected by a luminometer (TD-20/20, Turner Designs, Sunnyvale, CA), and in some cases bioluminescence from the in vivo liver was measured by a two-dimensional photon-counting camera (Imaging Photon Detector IPD 418, Photek, East Sussex, U.K.). An IBM PC-type computer continuously recorded data and integrated the bioluminescence for 20 min.
Under continuous luciferin application, bioluminescence was measured at ZT 3. Electrical stimulation for 30 min or adrenaline administration was then conducted. Sixty minutes after electrical stimulation or drug application, bioluminescence was remeasured.
Drug Injection Schedule. Adrenaline (epinephrine)·HCl, noradrenaline (norepinephrine)·HCl, phenylephrine·HCl, isoproterenol·HCl, and 6-hydroxydopamine (6-OHDA)·HCl were obtained from Nakarai (Osaka). All drugs were dissolved in saline for in vivo injection and in water for in vitro experimentation. To examine whether daily adrenaline injection could produce circadian clock gene expression in the liver, adrenaline or saline was i.p. injected daily into SCN-lesioned mice at a fixed time (ZT 22) for 6 consecutive days. Adrenaline or saline injection was not administered on days 7 and 8, and animals were killed at ZT 17 and 23 on day 7 and ZT 5 and 11 on day 8. Intact control animals were killed at ZT 3, 7, 11, 15, 19, and 23.
To reduce sympathetic nerve activity, 6-OHDA (100 mg/kg) was injected i.p. on days 1 and 3, and on day 4 mice were killed at ZT 5, 11, 17, and 23, and saline-injected mice were prepared as controls. Four days after the 6-OHDA injections, noradrenaline content was measured in the liver. An injection of 6-OHDA induced an 85% decrease in noradrenaline in the liver (unpublished observation), similar to that mentioned in previous papers (22, 23).
Measurement of Noradrenaline and Adrenaline Content by HPLC. After perfusion of ice-cold saline, an ≈500-mg liver block was dissected from intact or SCN-lesioned mice. After weighing, tissues containing noradrenaline and adrenaline were extracted with 500 μl of 0.5 M HClO4 by sonication. The concentration of liver noradrenaline or adrenaline was then detected by a standard HPLC–electrochemical detection system (Eicom, Tokyo). Details of the HPLC analytical method are reported by Wan et al. (24).
Statistics. Results are expressed as the mean ± SEM. The significance of differences between groups was determined by two-way or one-way analysis of variance (ANOVA) followed by Dunnett's test or Student's t test.
Results
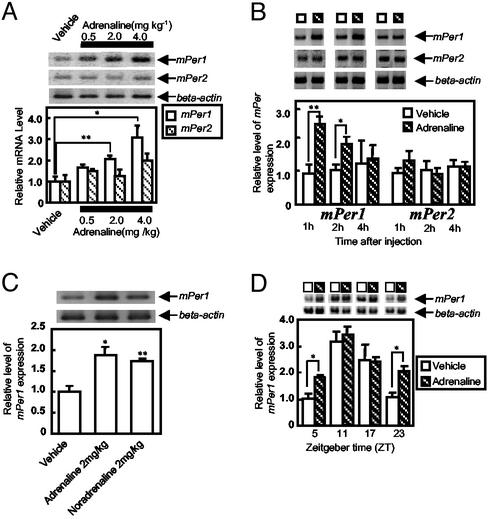
Acute Effect of Adrenaline on mPer Gene Expression in the Liver. The effect of acute i.p. adrenaline injection on mPer gene expression was examined in mouse liver (Fig. 1). Adrenaline increased mPer1 expression in a dose-dependent manner (Fig. 1 A). The increased mPer1 gene expression could still be observed 1 (P < 0.05) and 2 (P < 0.05) h after adrenaline injection (2 mg/kg) before it returned to control level after 4 h (Fig. 1B), whereas mPer2 gene expression was only slightly increased 1 h after injection (Fig. 1B). Adrenaline and noradrenaline exhibited almost an identical increase of mPer1 gene transcript in the liver (Fig. 1C). The mPer1 gene expression resulting from adrenaline injection exhibited a daily rhythm (Fig. 1D, striped bar) with a peak at ZT 11, and adrenaline elevated mPer1 gene expression in the liver when administered at ZT 5 (P < 0.05) and 23 (P < 0.05) but not at ZT 11 or 17 (Fig. 1D). The day (ZT 11)/night (ZT 23) differences (≈3- to 4-fold) in the mPer1 RT-PCR product were similar to the findings of our previous paper (18), suggesting that the present experimental conditions are reproducible and capable of detecting a circadian change of mPer1 gene expression in the mouse liver.
Fig. 1.
Effect of adrenaline on mPer expression in mouse liver. In the histograms, the vertical values reflect the relative mRNA levels of mPer1 or mPer2 as the ratio to β-actin mRNA levels. mPer1 or mPer2 levels in the vehicle-treated group are set at 1.0. Images of mPer1, mPer2, and β-actin RT-PCR products after electrophoresis are shown above each histogram. (A) Adrenaline treatment dose-dependently effects the expression of mPer1 but not mPer2 at ZT 3 (three to nine animals per point). (B) Time course of mPer1 and mPer2 gene expression after adrenaline injection (three to nine animals per point). (C) Adrenaline and noradrenaline comparison of the expression of mPer1 mRNA (three six animals per point). (D) Phase-dependent response of mPer1 gene expression with adrenaline injection (three to five animals per point). **, P < 0.01; *, P < 0.05; Student's t test.
Acute Effect of Adrenaline on mPer Gene Expression in Liver Slices in Vitro. We next examined the effect of adrenaline on mPer1 gene expression in liver slices under in vitro experimental conditions. Adrenaline application concentration-dependently increased mPer1 expression (P < 0.01, one-way ANOVA) (Fig. 2A). The α-adrenoreceptor agonist phenylephrine and β-adrenoreceptor agonist isoproterenol also elevated mPer1 gene expression in a concentration-dependent manner (Fig. 2 B and C, respectively). Thus, both α- and β-adrenoceptors may be involved in adrenaline-induced mPer1 gene expression. Phenylephrine-induced mPer1 gene expression was attenuated by pretreatment with U0126, a MAPK kinase inhibitor, and isoproterenol-induced elevation was attenuated by H89, a PKA inhibitor (Fig. 2 D and E). Similar hepatic slices were obtained from transgenic mice carrying mPer1 promoter-luciferase. Both the bioluminescence and RT-PCR product of intrinsic mPer1 gene transcript were measured in the same liver slice. Adrenaline (100 ng/ml) caused an elevation in both luminescence and RT-PCR product (Fig. 2F).
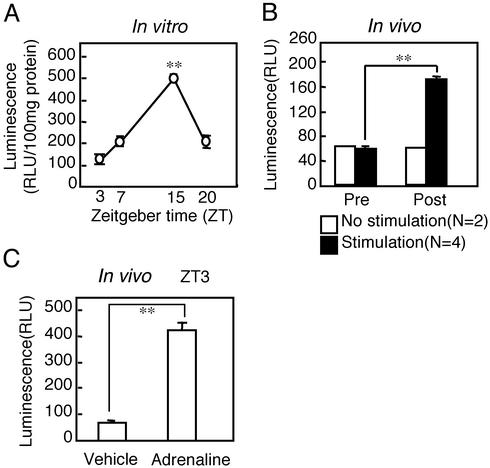
In Vitro Daily Rhythm of Liver mPer1 Activity Detected with Bioluminescence. A luciferase assay was conducted on liver slices at ZT 3, 7, 15, and 20. Luminescence was high at ZT 15 and low at ZT 3, suggesting a clear daily rhythm of mPer1 promoter activity present in the liver (Fig. 3A). This result correlates well with that of our previous report, which demonstrated a clear daily rhythm of luminescence in the SCN (18). The only difference is that the peak time of luminescence occurred from ZT 4–8 in the SCN, whereas the present results did not show the exact peak time of luminescence in the liver because luminescence was examined only at ZT 3, 7, 15, and 20. The baseline level of luminescence was between 20 and 30 RLU in the liver of mice lacking mPer1 promoter-luciferase (data not shown).
Fig. 3.
(A) Daily rhythm of bioluminescence in the liver of mPer1-luciferase transgenic mice. Sampling times were ZT 3, 7, 15, and 20 (three animals per point). Luminescence (RLU) is significantly higher at ZT 15 than at ZT 3 (**, P < 0.01; Dunnett's test). (B) Summary of mPer1-luc luminescence after electrical stimulation (EST) as described in the legend of Fig. 4. Prestimulation luminescence was measured at ZT 3, and post-EST luminescence was measured 60 min later. **, P < 0.01; Student's t test. (C) Luminescence (RLU) in the mouse liver 60 min after adrenaline (2 mg/kg) or saline injection at ZT 3 (three animals per point). **, P < 0.01; Student's t test.
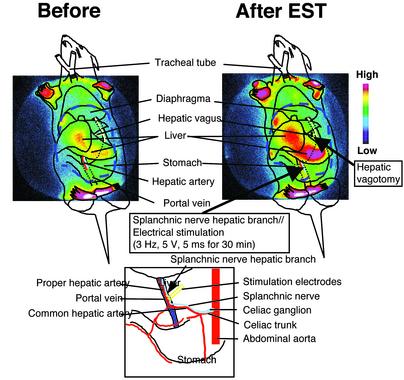
Effect of Sympathetic Nerve Stimulation on Liver mPer1 Activity. In the next experiment, we directly examined the effect of sympathetic nerve activation on mPer1 gene expression in vivo by using a luminometer. The baseline level of luminescence before electrical stimulation was ≈60 RLU. Electrical stimulation of the sympathetic nerves (3 Hz, 5 V, 5 ms for 30 min) at ZT 3 caused an elevation of luminescence in the liver. Summarized data are shown in Fig. 3B. The ≈3-fold, significant, increase in luminescence (Fig. 3B) returned to prestimulation level 2–3 h later. A similar increase in luminescence was observed 60 min after adrenaline injection (2 mg/kg) at ZT 3 (Fig. 3C). In the next experiment, we visualized mPer1-luc luminescence in the liver in vivo by using a two-dimensional photon-counting camera. Interestingly, electrical stimulation of the sympathetic nerves caused an elevation of luminescence in the region of the liver mainly innervated by sympathetic nerves (Fig. 4).
Fig. 4.
Visualization of elevated mPer1 transcription by electrical stimulation (EST) of the sympathetic nerve. The splanchnic nerve hepatic branch was electrically stimulated for 30 min (3 Hz, 5 V, 5 ms). (Upper Left) Luminescence before stimulation. (Upper Right) Luminescence after stimulation. Luminescence was recorded by a two-dimensional photon-counting camera. Luminescence in the liver was increased without affecting the front and rear paws. Images displayed with pseudocolor represent accumulated photo counts. The site of EST is shown in detail in Lower.
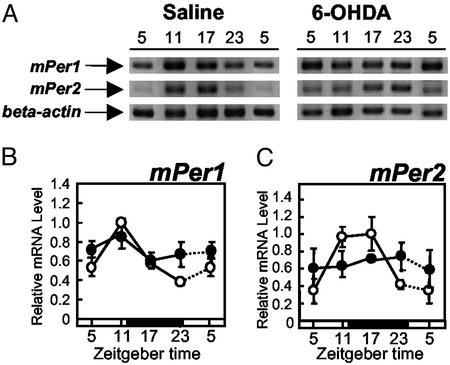
Effect of 6-OHDA Injection on mPer Gene Expression in the Liver. If sympathetic nerve activity is an important factor for maintaining the mPer gene expression rhythm in the liver, sympathetic denervation should reduce the oscillation of mPer gene expression there. Saline-injected control mice exhibited a significant daily rhythm of mPer1 (F3,8 = 26.7, P < 0.01) and mPer2 (F3,8 = 42.0, P < 0.01) gene expression in the liver (Fig. 5). Mice injected with 6-OHDA had attenuated daily expression rhythms of both mPer1 (F3,15 = 0.52, P > 0.05) and mPer2 mRNA (F3,15 = 0.15, P > 0.05) in the liver (Fig. 5). Two-way ANOVA revealed a significant difference (clock time × drug treatment) in mPer1 (F3,23 = 6.4, P < 0.05) and mPer2 (F3,23 = 19, P < 0.01) expression in the liver. 6-OHDA-injected mice showed significantly reduced food intake volume (18 ± 1.4 g per days 1–4 for saline, 9.3 ± 2.5 g per days 1–4 for 6-OHDA, P < 0.05, Student's t test) and total activity count (57,660 ± 363 per days 1–4 for saline, 19,604 ± 605 per days 1–4 for 6-OHDA, P < 0.05, Student's t test).
Fig. 5.
Effect of 6-OHDA injection on mPer1 (B) and mPer2 (C) gene expression in the liver. (A) Images of mPer1, mPer2, and β-actin RT-PCR products obtained from saline-injected or 6-OHDA-injected mice after electrophoresis. (B and C) Each animal was injected with either saline (○, three animals per point) or 6-OHDA (•, four or five animals per point) at ZT 12 on days 1 and 3. On day 4, animals were killed at each ZT. Relative mRNA level of mPer1 or mPer2 is shown as the ratio to β-actin mRNA level. Dotted lines represent duplicate data at ZT 5 in the respective groups.
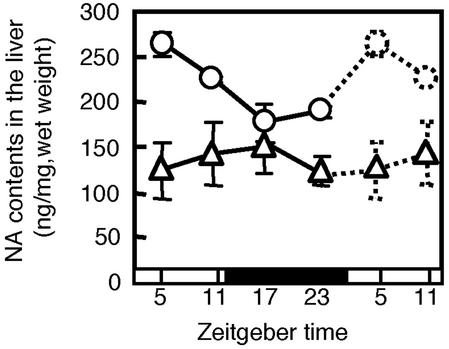
Effect of SCN Lesion on Noradrenaline Content in the Liver. If daily change in the concentration of noradrenaline and/or adrenaline is the trigger factor to maintain mPer1 and mPer2 oscillation in the liver, then the concentration of these amines should oscillate. In the intact liver, noradrenaline exhibited a significant daily rhythm that peaked at ZT 4 (F3,8 = 10.3, P < 0.01) (Fig. 6), whereas the concentration of adrenaline could not be detected under this experimental protocol. With destruction of the SCN, the daily rhythm of noradrenaline was almost blunted in the liver (F3,9 = 0.6, P > 0.05) (Fig. 6), and there was a significant difference (clock time × lesion) between the SCN-lesioned and intact mice (F3,17 = 4.8, P < 0.05, two-way ANOVA).
Fig. 6.
Daily pattern of noradrenaline content in the liver of SCN-lesioned (▵) (three or four animals per point) or intact (○) (three animals per point) mice. Dotted lines represent duplicate data at ZT 5 and 11 in the respective groups.
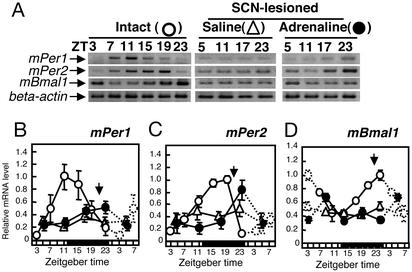
Effect of Daily Adrenaline Injection on Oscillation of mPer in the Liver of SCN-Lesioned Arrhythmic Mice. If adrenergic stimulation is important to maintain clock gene oscillation in the liver, daily injection of noradrenaline or adrenaline may start the oscillation of mPer and mBmal1 gene expression in the liver of SCN-lesioned arrhythmic mice. It has already been reported that daily injection of adrenaline causes anticipatory activity in rats.∥ Furthermore, because the application of adrenaline increased mPer1 gene expression in a manner similar to noradrenaline (Fig. 2), we chose adrenaline instead of noradrenaline to avoid the potential interference of intrinsic noradrenaline with injected noradrenaline. Findings indicated the daily expression of mPer1, mPer2, and mBmal1 was lost in the circadian component of saline-injected, SCN-lesioned mice (F3,13 = 0.9, P > 0.05 for mPer1, F3,14 = 0.45, P > 0.05 for mPer2; F3,14 = 0.46, P > 0.05 for mBmal1, one-way ANOVA) (Fig. 7 B–D). On the other hand, daily adrenaline injection produced oscillations of mPer2 and mBmal1 gene expression in the liver of SCN-lesioned arrhythmic mice. Statistical analysis demonstrated robust rhythms in mPer2 gene expression (F3,13 = 5.3, P < 0.05, one-way ANOVA; F3,27 = 2.9, P < 0.05, two-way ANOVA; Fig. 7C) and mBmal1 (F3,15 = 4.4, P < 0.05, one-way ANOVA; F3,29 = 3.4, P < 0.05, two-way ANOVA; Fig. 7D), but no significant rhythm in mPer1 gene expression (F3,13 = 2.1, P > 0.05; Fig. 7B). A significant elevation of mPer1 gene expression was detected 2 h after adrenaline injection on day 6 (data not shown), suggesting that there is no tolerance effect of adrenaline on mPer1 gene expression in the liver. Interestingly, adrenaline did not elevate mPer2 gene expression on day 6, but the basal level of mPer2 gene expression was found to be already elevated (data not shown).
Fig. 7.
Effect of daily adrenaline injection on mPer1 (B), mPer2 (C), and mBmal1 (D) gene expression in the liver of SCN-lesioned, arrhythmic mice. Shown are images after electrophoresis (A) and relative mRNA levels (B–D)of mPer1, mPer2, mBmal1, and β-actin RT-PCR products obtained from intact mice (○, three to six animals per point), daily saline-injected SCN-lesioned mice (▵, three to six animals per point), and daily adrenaline-injected SCN-lesioned mice (•, three to five animals per point). Relative mRNA level of mPer1, mPer2, or mBmal1 is shown as the ratio to β-actin mRNA level. Dotted lines represent duplicate data at ZT 3, 5, 7, and 23 in the respective groups.
To confirm whether the circadian peak of mPer2 expression depends on adrenaline injection time, injections were conducted at ZT 10 for 6 days. This treatment drove hepatic mPer2 gene oscillations at opposite phases (0.42 ± 0.02 relative mRNA level for saline, 0.60 ± 0.06 for adrenaline, P < 0.05, Student's t test, at ZT 11; 0.42 ± 0.05 for saline, 0.25 ± 0.01 for adrenaline, at ZT 23). Repeated injection of adrenaline at ZT 22 or ZT 10 for 6 days, however, could not induce a circadian locomotor rhythm in SCN-lesioned mice (data not shown).
Discussion
In the present study, SCN-lesioned arrhythmic mice injected periodically with adrenaline produced a robust circadian rhythm of mPer2 and mBmal1 in the liver the day after termination of adrenaline treatment. This evidence demonstrates adrenergic regulation of clock gene oscillation in the peripheral tissues. The present results elucidated that clock gene expression was initiated into at least one cycle by adrenaline delivery. Such an oscillation of clock gene expression was reportedly produced in the liver after daily restricted feeding, corresponding with food delivery (9, 25, 26).
Recently it was reported that retinoic acids (27), the epidermal growth factor receptor (28), and glucocorticoids (29) function as humoral factors for resetting the mouse peripheral clock. In addition, high serum concentration (30), forskolin (6), phorbol ester (31), and multiple signaling pathways including glucocorticoid (32) elicit the circadian gene expression of Per in cells such as rat-1, NIH 3T3, and fibroblasts. Among these substances, glucocorticoids have been considered to be particularly well suited as Zeitgebers for peripheral oscillators used by the SCN to synchronize peripheral clocks. However, Stokkan et al. (26) demonstrated that the rephasing of cyclic gene expression in the rat liver cannot be mimicked through repeated daily injection of corticosterones. In addition, the steady-state phase of circadian gene expression in the liver was unaffected by ablation of the glucocorticoid receptor gene (29). Thus, glucocorticoid hormones cannot be the sole Zeitgeber for peripheral tissues. Many kinds of chemicals may possess the potential to produce oscillation in the peripheral tissues and cells. We have now added the possibility of sympathetic neuron-regulated resetting in the peripheral organs.
The present results demonstrate that both adrenergic and sympathetic nerve stimulation resulted in elevated luminescence in the liver of transgenic mice carrying the mPer1 promoter-luciferase. We have succeeded in visualizing mPer1 expression in the mammalian peripheral organs under in vivo conditions. Thus, a powerful feature of the mPer1-luc mouse is the ability to longitudinally follow mPer1 gene expression in individual tissues in real time.
In the present experiment, we demonstrated that destruction of the SCN resulted in disappearance of not only mPer1, mPer2, and mBmal1 circadian rhythms in the liver but also the noradrenaline content rhythm. In addition, the present results demonstrated that sympathetic nerve denervation by 6-OHDA treatment reduced the oscillation of mPer gene expression in the liver. As injection of 6-OHDA reduced both food intake and locomotor activity, involvement of metabolic change in the reduced oscillation of mPer gene expression could not be ruled out. It was already reported that light exposure elevated hepatic sympathetic nerve activity through the SCN (33). Thus, all evidence combined suggests that SCN regulation of the peripheral clock gene expression rhythm involves sympathetic nerve activation.
In the present experiments, the mPer1 gene expression induced by phenylephrine, an α-adrenoreceptor agonist, and isoproterenol, a β-adrenoreceptor agonist, was attenuated by MAPK kinase inhibitor and PKA inhibitor, respectively. It is well known that increased CREB phosphorylation through the activation of MAPK (31) and PKA (34) is closely associated with induction of Per gene expression in several types of cells.
Application of forskolin elicited a robust circadian oscillation of Per2 gene expression in rat-1 cells accompanied by weak oscillation of the Per1 gene (6). In addition, in the liver tissue, restricted feeding-induced oscillation of the Per2 gene continues for 24–36 h after food withdrawal, whereas that of the Per1 gene is dampened (25). Thus, the above results combined with the line of evidence that PER1, PER2, and PER3 all interact (35), lead us to hypothesize that the mPER1 produced by daily adrenergic stimulation directly or indirectly induces the initiation of mPer2 and mBmal1 oscillation in the liver, although a detailed mechanism explaining the weak oscillation of mPer1 has yet to be elucidated.
Recent papers have shown that in mice with a targeted mutation in mPer genes, mPer2, but not mPer1 and mPer3, is essential for locomotor activity rhythm originated from core circadian oscillation in the SCN (36–38). While the role of mPer1 is obscured in the SCN circadian oscillation, mPer1 is active to form peripheral clock oscillation and/or its output (36), suggesting that the mPer1 expression in the liver induced by acute adrenaline injection may have some role in oscillation of the peripheral clock rhythm.
Recent findings denoted that the presence of NADH and NADPH facilitates the dimerization of BMAL1:CLOCK (39). The redox state may be the main signal triggering oscillations in peripheral tissues such as the liver (40). Rutter et al. (39) speculated that restricted feeding entrains the molecular rhythm directly by means of induced change in cellular redox potential. Interestingly, sympathetic activation and adrenaline injection produced glycogenolysis and pyruvate and lactate release in the liver (41, 42); thus, reduction of the cytoplasmic redox state in the liver may promote the circadian oscillation of clock genes in the liver. Daytime feeding can induce large phase shifts in mice in which glucocorticoid signaling has been interrupted (43). Thus, reduction of this signaling may facilitate the development of circadian clock gene oscillation induced by repeated adrenaline injections.
In summary, we demonstrated that sympathetic nerve activity through catecholamine release may participate in conveying central clock information to peripheral organs.
Acknowledgments
This study was partially supported by grants from the Japanese Ministry of Education, Science, Sports, and Culture (11233207, 13470016, and 12877385 to S.S.), the Kanae Foundation for Life and Socio- and Medical Science and the Inamori Foundation (to S.Y.), and the Cosmetology Research Foundation (to H.O.), and by Special Coordination Funds from the Japanese Ministry of Education, Culture, Sports, Science, and Technology (to S.S. and H.O.).
This paper was submitted directly (Track II) to the PNAS office.
Abbreviations: SCN, suprachiasmatic nucleus; ZT, Zeitgeber time (in hours); RLU, relative light units; 6-OHDA, 6-hydroxydopamine; MAPK, mitogen-associated protein kinase; PKA, protein kinase A.
Footnotes
Mendoza, J. Y., Avila, J., Aguilar-Roblero, R. A. & Escobar, C., 31st Annual Meeting of the Society for Neuroscience, Nov. 10–15, 2001, San Diego, p. 183.116 (abstr.).
References
- 1.Inouye, S. T. & Shibata, S. (1994) Neurosci. Res. 20, 109-130. [DOI] [PubMed] [Google Scholar]
- 2.Dunlap, J. C. (1999) Cell 96, 271-290. [DOI] [PubMed] [Google Scholar]
- 3.Kume, K., Zylka, M. J., Sriram, S., Shearman, L. P., Weaver, D. R., Jin, X., Maywood, E. S., Hastings, M. H. & Reppert, S. M. (1999) Cell 98, 193-205. [DOI] [PubMed] [Google Scholar]
- 4.Akiyama, M., Kirihara, T., Takahashi, S., Minami, Y., Yoshinobu, Y., Moriya, T. & Shibata, S. (1999) Br. J. Pharmacol. 128, 1616-1622. [DOI] [PMC free article] [PubMed] [Google Scholar]
- 5.Sakamoto, K., Nagase, T., Fukui, H., Horikawa, K., Okada, T., Tanaka, H., Sato, K., Miyake, Y., Ohara, O., Kako, K. & Ishida, N. (1998) J. Biol. Chem. 273, 27039-27042. [DOI] [PubMed] [Google Scholar]
- 6.Yagita, K. & Okamura, H. (2000) FEBS Lett. 465, 79-82. [DOI] [PubMed] [Google Scholar]
- 7.Moore, R. Y. & Eichler, V. B. (1972) Brain Res. 42, 201-206. [DOI] [PubMed] [Google Scholar]
- 8.Meyer-Bernstein, E. L., Jetton, A. E., Matsumoto, S. I., Markuns, J. F., Lehman, M. N. & Bittman, E. L. (1999) Endocrinology 140, 207-218. [DOI] [PubMed] [Google Scholar]
- 9.Hara, R., Wan, K., Wakamatsu, H., Aida, R., Moriya, T., Akiyama, M. & Shibata, S. (2001) Genes Cells 6, 269-278. [DOI] [PubMed] [Google Scholar]
- 10.Akhtar, R. A., Reddy, A. B., Maywood, E. S., Clayton, J. D., King, V. M., Smith, A. G., Gant, T. W., Hastings, M. H. & Kyriacou, C. P. (2002) Curr. Biol. 12, 540-550. [DOI] [PubMed] [Google Scholar]
- 11.Inouye, S. T. & Kawamura, H. (1979) Proc. Natl. Acad. Sci. USA 76, 5962-5966. [DOI] [PMC free article] [PubMed] [Google Scholar]
- 12.Silver, R., LeSauter, J., Tresco, P. A. & Lehman, M. N. (1996) Nature 382, 810-813. [DOI] [PubMed] [Google Scholar]
- 13.Bartness, T. J., Song, C. K. & Demas, G. E. (2001) J. Biol. Rhythms 16, 196-204. [DOI] [PubMed] [Google Scholar]
- 14.Larsen, P. J., Enquist, L. W. & Card, J. P. (1988) Eur. J. Neurosci. 10, 128-145. [DOI] [PubMed] [Google Scholar]
- 15.Bamshad, M., Aoki, V. T., Adkison, M. G., Warren, W. S. & Bartness, T. J. (1998) Am. J. Physiol. 275, R 291-R299. [DOI] [PubMed] [Google Scholar]
- 16.Buijs, R. M. & Kalsbeek, A. (2001) Nat. Rev. Neurosci. 2, 521-526. [DOI] [PubMed] [Google Scholar]
- 17.Kalsbeek, A., Fliers, E., Romijn, J. A., La Fleur, S. E., Wortel, J., Bakker, O., Endert, E. & Buijs, R. M. (2001) Endocrinology 142, 2677-2685. [DOI] [PubMed] [Google Scholar]
- 18.Yamaguchi, S., Mitsui, S., Miyake, S., Yan, L., Onishi, H., Yagita, K., Suzuki, M., Shibata, S., Kobayashi, M. & Okamura, H. (2000) Curr. Biol. 10, 873-876. [DOI] [PubMed] [Google Scholar]
- 19.Ohdo, S., Koyanagi, S., Suyama, H., Higuchi, S. & Aramaki, H. (2001) Nat. Med. 7, 356-360. [DOI] [PubMed] [Google Scholar]
- 20.Wakamatsu, H., Yoshinobu, Y., Aida, R., Moriya, T., Akiyama, M. & Shibata, S. (2001) Eur. J. Neurosci. 13, 1190-1196. [DOI] [PubMed] [Google Scholar]
- 21.Mutoh, T., Shibata, S., Korf, H. & Okamura, H. (2003) J. Physiol. 547, 317-332. [DOI] [PMC free article] [PubMed] [Google Scholar]
- 22.Song, D. K., Im, Y. B., Jung, J. S., Suh, H. W., Huh, S. O., Park, S. W., Wie, M. B. & Kim, Y. H. (1999) J. Neurochem. 72, 1625-1633. [DOI] [PubMed] [Google Scholar]
- 23.Matias, A., Soares-da-Silva, P. & Azevedo, I. (1993) J. Auton. Pharmacol. 13, 275-280. [DOI] [PubMed] [Google Scholar]
- 24.Wan, K., Moriya, T., Akiyama, M., Takeshima, H. & Shibata, S. (1999) Biochem. Biophys. Res. Commun. 266, 588-592. [DOI] [PubMed] [Google Scholar]
- 25.Damiola, F., Le Minh, N., Preitner, N., Kornmann, B., Fleury-Olela, F. & Schibler, U. (2000) Genes Dev. 14, 2950-2961. [DOI] [PMC free article] [PubMed] [Google Scholar]
- 26.Stokkan, K. A., Yamazaki, S., Tei, H., Sakaki, Y. & Menaker, M. (2001) Science 291, 490-493. [DOI] [PubMed] [Google Scholar]
- 27.McNamara, P., Seo, S. P., Rudic, R. D., Sehgal, A., Chakravarti, D. & FitzGerald, G. A. (2001) Cell 105, 877-889. [DOI] [PubMed] [Google Scholar]
- 28.Kramer, A., Yang, F. C., Snodgrass, P., Li, X., Scammell, T. E., Davis, F. C. & Weitz, C. J. (2001) Science 294, 2511-2515. [DOI] [PubMed] [Google Scholar]
- 29.Balsalobre, A., Brown, S. A., Marcacci, L., Tronche, F., Kellendonk, C., Reichardt, H. M., Schutz, G. & Schibler, U. (2000) Science 289, 2344-2347. [DOI] [PubMed] [Google Scholar]
- 30.Balsalobre, A., Damiola, F. & Schibler, U. (1998) Cell 93, 929-937. [DOI] [PubMed] [Google Scholar]
- 31.Akashi, M. & Nishida, E. (2000) Genes Dev. 14, 645-649. [PMC free article] [PubMed] [Google Scholar]
- 32.Balsalobre, A., Marcacci, L. & Schibler, U. (2000) Curr. Biol. 10, 1291-1294. [DOI] [PubMed] [Google Scholar]
- 33.Nijima, A., Nagai, K., Nagai, M.& Akagawa, H. (1993) Physiol. Behav. 54, 555-561. [DOI] [PubMed] [Google Scholar]
- 34.Akiyama, M., Minami, Y., Nakajima, T., Moriya, T. & Shibata, S. (2001) J. Neurochem. 78, 499-508. [DOI] [PubMed] [Google Scholar]
- 35.Yagita, K., Yamaguchi, S., Tamanini, F., van Der Horst, G. T., Hoeijmakers, J. H., Yasui, A., Loros, J. J., Dunlap, J. C. & Okamura, H. (2000) Genes Dev. 14, 1353-1363. [PMC free article] [PubMed] [Google Scholar]
- 36.Cermakian, N., Monaco, L., Pando, M. P., Dierich, A. & Sassone-Corsi, P. (2001) EMBO J. 20, 3967-3974. [DOI] [PMC free article] [PubMed] [Google Scholar]
- 37.Shearman, L. P., Jin, X., Lee, C., Reppert, S. M. & Weaver, D. R. (2000) Mol. Cell. Biol. 20, 6269-6275. [DOI] [PMC free article] [PubMed] [Google Scholar]
- 38.Zheng, B., Albrecht, U., Kaasik, K., Sage, M., Lu, W., Vaishnav, S., Li, Q., Sun, Z. S., Eichele, G., Bradley, A. & Lee, C. C. (2001) Cell 105, 683-694. [DOI] [PubMed] [Google Scholar]
- 39.Rutter, J., Reick, M., Wu, L. C. & McKnight, S. L. (2001) Science 293, 510-514. [DOI] [PubMed] [Google Scholar]
- 40.Merrow, M. & Roenneberg, T. (2001) Cell 106, 141-143. [DOI] [PubMed] [Google Scholar]
- 41.Racotta, R., Islas-Chaires, M., Vega, C., Soto-Mora, M. & Russek, M. (1984) Am. J. Physiol. 246, R247-R250. [DOI] [PubMed] [Google Scholar]
- 42.MacIsaac, L. & Geary, N. (1985) Physiol. Behav. 35, 233-237. [DOI] [PubMed] [Google Scholar]
- 43.Le Minh, N., Damiola, F., Tronche, F., Schutz, G. & Schibler, U. (2001) EMBO J. 20, 7128-7136. [DOI] [PMC free article] [PubMed] [Google Scholar]


