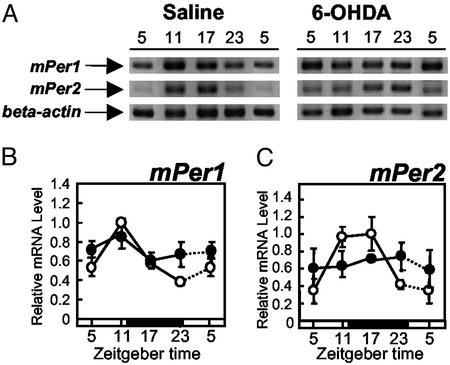
Fig. 5.
Effect of 6-OHDA injection on mPer1 (B) and mPer2 (C) gene expression in the liver. (A) Images of mPer1, mPer2, and β-actin RT-PCR products obtained from saline-injected or 6-OHDA-injected mice after electrophoresis. (B and C) Each animal was injected with either saline (○, three animals per point) or 6-OHDA (•, four or five animals per point) at ZT 12 on days 1 and 3. On day 4, animals were killed at each ZT. Relative mRNA level of mPer1 or mPer2 is shown as the ratio to β-actin mRNA level. Dotted lines represent duplicate data at ZT 5 in the respective groups.

