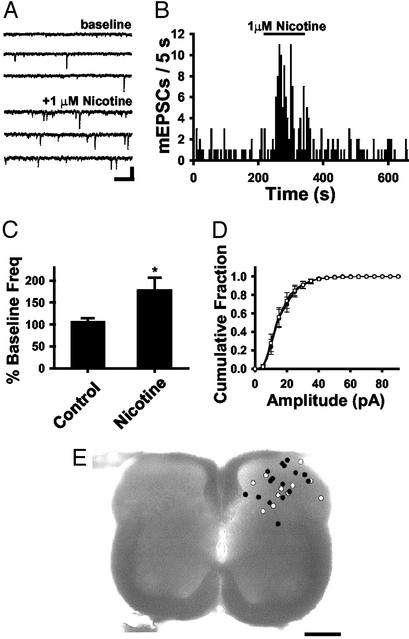
Fig. 1.
Nicotine enhances glutamatergic transmission in the SCDH. (A) Voltage-clamp recording from a SCDH neuron from control and with 1 μM nicotine (Vh = -70 mV). (Bar = 20 pA, 250 ms.) (B) Frequency histogram showing an increase in glutamatergic mEPSCs with 1 μM nicotine. (C) The average normalized frequency data from all neurons (n = 27; *, P < 0.05) compared with control without nicotine (n = 10). (D) Cumulative distributions illustrate no difference in average mEPSC amplitudes during baseline and nicotine treatment (P > 0.05). (E) The locations of recorded neurons presented as nicotine responders (n = 16, filled circles) or nonresponders (n = 11, open circles). (Bar = 250 μm.)

