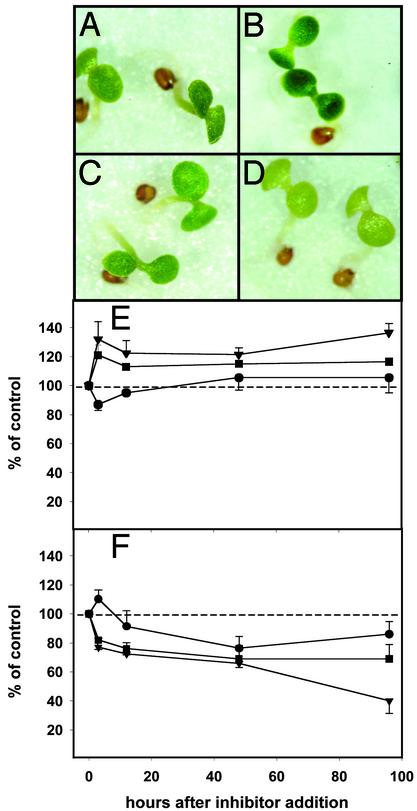
Fig. 2.
Effects of inhibitor treatments on A. thaliana seedlings; phenotypic characteristics of control seedlings for lovastatin experiments (A); lovastatin-treated seedlings (B); control seedlings for fosmidomycin experiments (C); fosmidomycin-treated seedlings (D); levels of sterols (•), chlorophylls (▾), and carotenoids (▪) (± standard deviation) in the presence of lovastatin, and fosmidomycin (E and F). Values were calculated on 1 μg/g fresh-weight basis and were normalized (100% for mock control). Fresh weight per seedling did not change significantly with the various treatments.

