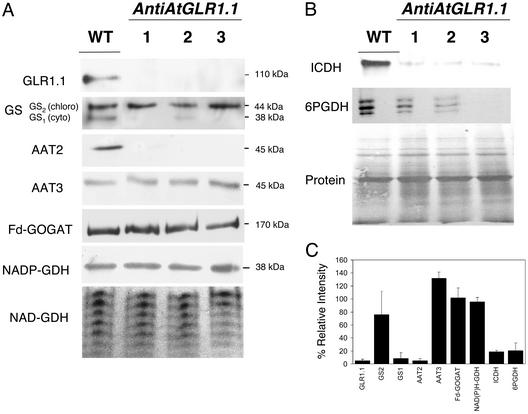
Fig. 3.
Accumulation of C and N metabolic isoenzymes in WT and antiAtGLR1.1 plants. (A) Crude total protein preparations from the leaves of 30-day-old Arabidopsis plants were subjected to SDS/PAGE, blotted onto nitrocellulose, stained for protein by using BLOT-FastStain (Geno Technology, St. Louis), destained, and used for immunoblot analysis with antiserum to specific N/C-metabolic enzymes, GS, Fd-GOGAT, AAT, and NADP(H)-dependent GDH. An enzyme activity stain was used to visualize the seven NAD-dependent GDH isoenzymes. (B) Accumulation of select C-metabolic isoenzymes was studied with enzyme stains to visualize the activities of 6PGDH and ICDH. (C) Results from densitometric analysis of immunoblots and enzyme stains. The band intensity for each of the three transgenic lines was determined and used to calculate the mean intensity for each band. The results were expressed as a percentage of the control (100%) ± SD.

