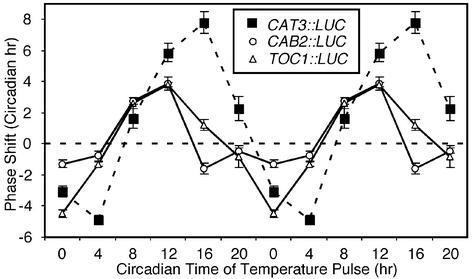
Fig. 4.
tPRCs reveal that the response of CAT3 to a temperature pulse is distinct from the responses of CAB2 and TOC1. Plants were grown in LD cycles for 7 days and placed on a Packard TopCount luminometer for 1 day of LD. A series of 4-hr 12°C temperature pulses was applied at 4-hr intervals over a 24-hr day after the first full day in LL. Period and phase were determined by fast Fourier transform nonlinear least squares (16), and phase advances and delays were determined compared with a mock-treated control. Data for CAT3::LUC (▪), CAB2::LUC (○), and TOC1::LUC (▵) represent mean ± SEM for three independent experiments and are double plotted for visualization purposes.

